Gifford Miller’s most recent study on radiocarbon dates of Baffin Island moss has attracted recent publicity, including covers at Judy Curry, WUWT and Jim Bouldin, due to its claim to have demonstrated that the present is the warmest in 44000 years.
Over the past decade, Miller has been taking radiocarbon dates on moss exposed from receding glaciers/ice caps on Baffin Island. Up to his most recent study, these dates have been used to develop a chronology of ice expansion and recession. Miller’s sampling protocol focuses on “ice caps” rather (moving) glaciers and on short-lived moss (rather than longer-lived macrofossils). Miller assumes (reasonably enough) that the moss was engulfed by ice cap expansion – the expansion indicating a decline in temperature – and that the moss has not been subsequently exposed (since it degrades relatively rapidly upon exposure).
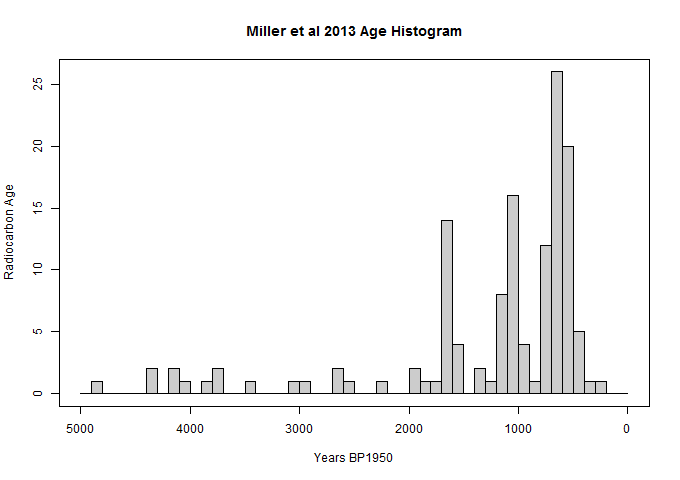
Miller’s article reports on 145 radiocarbon dates from recently-exposed moss, the vast majority of which are dated to the past two millennia, as shown in the histogram below of radiocarbon ages for the 135 Holocene dates (plus 10 pre-Holocene dates.)
Figure 1. Histogram of Radiocarbon Ages from Recently Exposed Baffin Island mosses (Miller et al 2013 GRL). Note: y-axis label is wrong. This is a histogram and y-axis is counts.
At the majority of locations, receding ice is exposing moss that was engulfed by Little Ice Age glacier expansion. At a sizable minority of locations, receding ice is exposing moss that was engulfed by earlier glacier expansions (especially first millennium AD and first millennium BC). These Holocene glacier expansions are consistent with other millennial evidence e.g. treelines moving south, ice core melt and oxygen isotopes. In an unpublicized part of Miller et al 2013, Miller estimated a secular lowering of glacier of 129 m/ 1000 years, with a 19th century low about 200 m below 20th century levels.
From the lowering of glacier lines, Miller estimated a reduction of about 2.7 deg C in summer temperature over the past 6000 years or so. Miller observed that estimates from CMIP5 climate models were much lower – about 1.1 deg C – from which he deduced that things were worse than we thought.
Some of the exposed samples are increasingly earlier in the Holocene, with the earliest Holocene sample at 4285 radiocarbon BP (calibrated 4900 BP). It should be noted that these dates do not coincide with peak Holocene warmth, dated to ~6000-7000 BP on much other evidence.
In addition to the 135 sites where Late and Holocene mosses have been exposed, Miller sampled 4 sites (10 samples) where the mosses were dated deep into the LGM or at or near the radiocarbon detection limit (~44000 years). It was on the basis of these samples that the warmest in 44000 years claim arose.
Curiously, this claim is remarkably similar to claims made by Lonnie Thompson in 2005 at Quelccaya (see CA discussion here, here here). In this case, “remarkably similar” means remarkably similar as normally understood, rather than as used in climate science. Thompson also based his claim on radiocarbon dates from moss (Distichia) exposed by receding glaciers. As in Baffin Island, the vast majority of Quelccaya radiocarbon dates were from the 4200BP and later, but there was at least one at the radiocarbon detection limit. Like Miller, Thompson hypothesized that this moss was evidence that temperatures were the warmest since the Eemian.
Since Thompson’s 2005 news release, there have been a couple of academic articles on the Quelccaya moss with Holocene dates, e.g. here which reported:
In this case, we can infer that not only one species but a community of plants occurred at a high-elevation location ∼5000 yr ago under likely warmer conditions.
However, I haven’t seen anything further about Thompson’s “Eemian” moss. If anyone knows anything more, I’d be interested. The outcome of Thompson’s “Eemian” moss seems like it would be relevant to the appraisal of Miller’s Eemian moss.
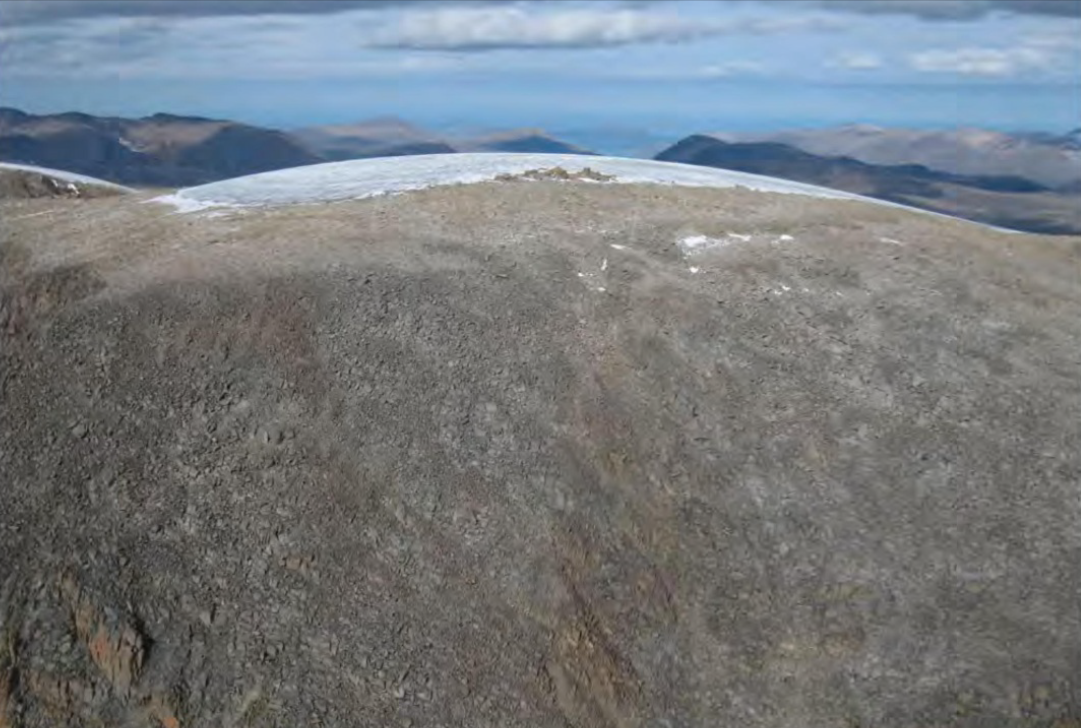
Miller et al provided the following helpful photo of the location from which one of the “Eemian” samples was taken. Miller commented that the moss is observed only in the immediate receding vicinity: the rock quickly becomes barren.
Figure 2. Photo of site of samples M10-B231v and B232v, dated at or near detection limit.
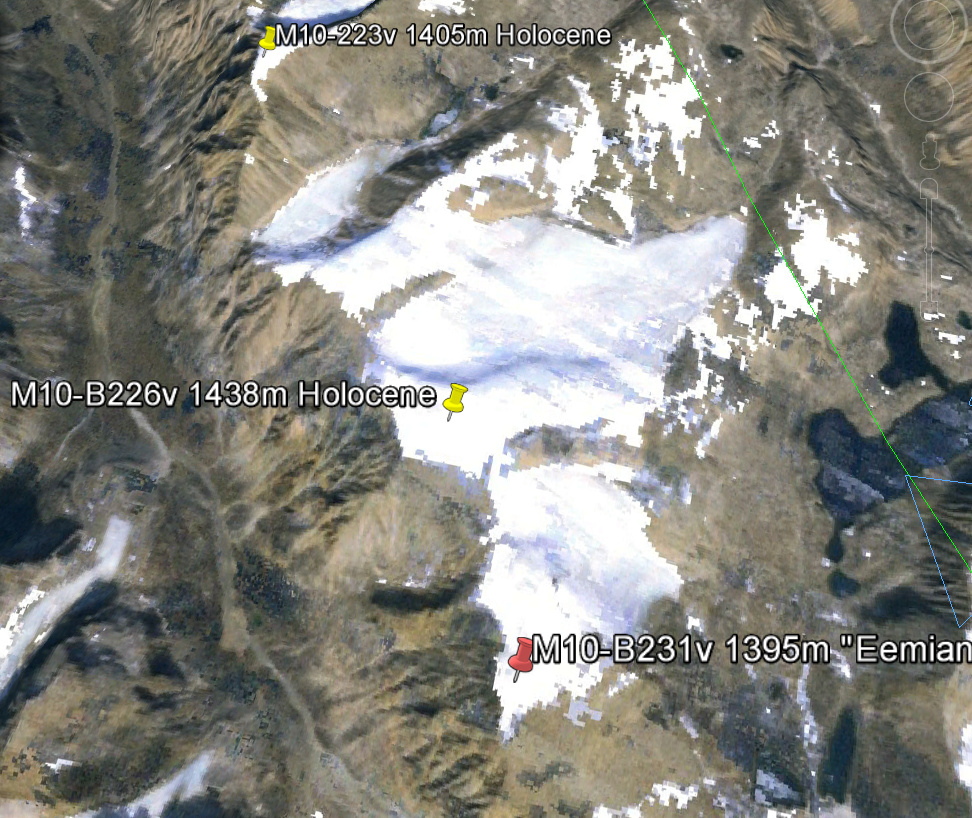
There are a couple of nearby locations at which the exposed moss from receding ice caps at slightly greater altitudes merely has Holocene dates. “Eemian” sample B231v is at 1395m altitude. However, samples B223v and B226v are both slightly higher and located nearby (with a km or two) along the same ridge, but the exposed moss is merely Holocene (~4200 BP). A question: How does one reconcile the supposed in situ continuity of the little “ice cap” in the vicinity of sample M10-B231v (1395 m) since 44000 BP with recession in the vicinity of nearby higher M10-B226v (1438 m)?
Figure 3. Google Earth map in area of M10-231v.
Postscript: I’ve covered Miller’s work (relatively favorably) in the past – see here and here. Miller is a reputable scientist whose work rises above the data snooping, data mining and regression against increasing trends of self-opinionated verbiage (to borrow Briffa’s phrase) that is too prevalent in the field.
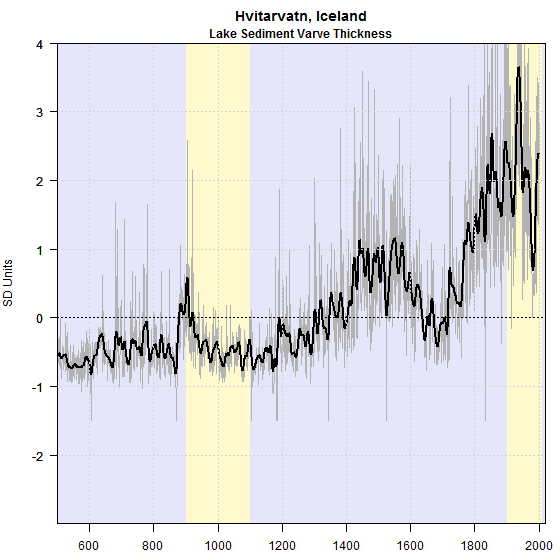
Much of Miller’s work has been the articulation of Late Holocene glaciation, up to and including its relative maximum in the Little Ice Age, from which numerous Baffin Island locations are still emerging in his recent study. Miller was coauthor of the Hvitavatn (Iceland) sediment series, with Miller attributing the Little Ice Age maximum of this proxy to cold, rather than warmth, and conversely for the Medieval period. As I noted in my coverage of PAGES2K, Kaufman and the PAGES2K authors used Miller’s series upside down, thereby attributing its 19th century maximum to warmth rather than cold. The PAGES2K Arctic reconstruction does not stand or fall on this error. However, it is one of relatively few series that show any Stick-ness and the other Stick contributors also have serious problems (e.g. contaminated sediments.)
Figure 4. Gifford Miller’s Hvitavatn series as used by PAGES2K Arctic.
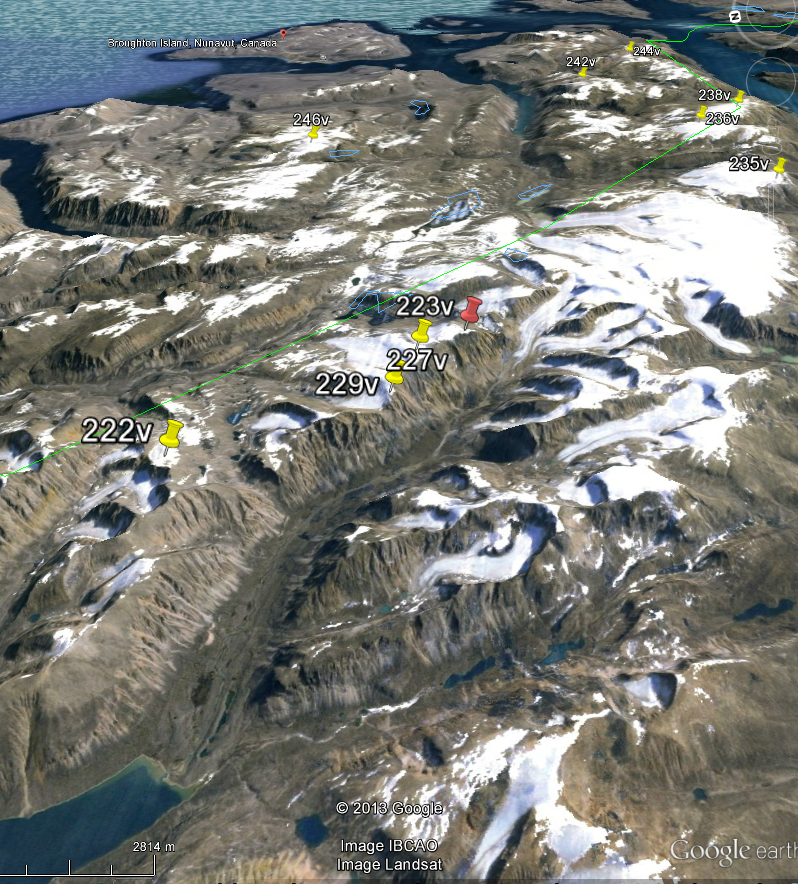
Update: Oct 27. Andrews et al 1972 has an air photo on which the locations of B221v and B223v are shown. First, here is a google earth image looking east towards Broughton Island with sites marked – oriented to correspond to the 1972 air photo. The red pin shows the location of the ancient moss.
Next here is the air photo from Andrews et al 1972.
After discussing recent deterioration in summer temperatures, Andrews et al 1972 observed:
The evidence strongly suggests that glaciation of Baffin Island will herald the next glaciation of North America although the timing of such development is unknown. The climatic glacial mode may develop rapidly, but there is a lag of the order of 10,000 years in the subsequent buildup of a continental ice sheet… The recent climatic fluctuations in the area are on too short a timescale to be viewed with alarm. The main control on glacierization in eastern Baffin Island is snowfall, not temperature.
Co-authors of Andrews et al 1972 included Gifford Miller and Raymond Bradley.