Earlier this year, David Whitehouse of GWPF drew attention to a striking decrease in the UK Met Office decadal temperature forecast, that had been quietly changed by the Met Office on Christmas Eve. Whitehouse’s article led to some contemporary interest in Met Office decadal forecasts. The Met Office responded (see here); Whitehouse was also challenged by Greenpeace columnist Bob Ward.
Fast forward to July 10, 2013. Using UK Met Office decadal forecasts, Jeff Tollefson of Nature reported as a “News Feature” that “The forecast for 2018 is cloudy with record heat”, covered by Judy Curry here.
An innocent reader would presume that a Nature “News Feature” reporting on Met Office decadal forecasts would include the current Met Office decadal forecast. However, this proves not to be the case. Tollefson showed an older decadal forecast issued prior to the downward revision of the Met Office decadal forecast to which Whitehouse had drawn attention. Tollefson showed the multi-model mean from Smith et al 2012 (Clim Dyn), which has negligible difference from the 2011 Met Office decadal forecast. Had Tollefson shown the “decline” in the current decadal forecast, Nature would not have been able to make the same unequivocal headline.
Three Models
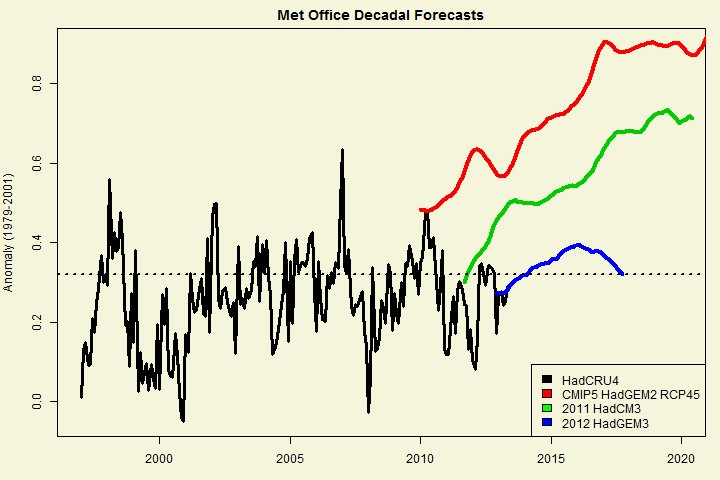
The differences between Met Office GCM versions is probably not as widely appreciated as it ought to be. In the figure below, I’ve illustrated differences between three modern Met Office models: HadGEM2 (red), which was submitted to IPCC AR5; HadCM3 (green), which was used in the old (2011) decadal forecast and in the recent Nature article; HadGEM3 (blue), which is used in the current (2012) decadal forecast. Links to data are provided in the caption to the figure.
As an editorial comment, the more that I look at the graphic below, the differences seem all the more remarkable and well worth a Nature News article that is more searching than Tollefson’s Met Office hagiography. The successive iterations of Met Office models more or less flap to the leeward of observations, like a version of the Gambian flag in the trade winds.
The closing 12 months of the new decadal forecast (more or less 2016.76-2017.75) are a remarkable 0.52 deg (!) cooler than the IPCC submission.
Figure 1. Three recent Met Center forecasts. Red- HadGEM2-ES-rpc45 average downloaded from KNMI here showing “forecast” portion, estimated to be 2010 on; the hindcast is shown in dotted red. [July 16 -HadGEM2 is "uninitialized", whereas the decadal forecasts are updated to include recent data.] Green – Met Office 2011 decadal forecast obtained by email and uploaded to here. Blue – Met Office 20112 decadal forecast obtained by email, uploaded to here. Black: HadCRUT4. Anomaly 1979-2001 is used to match Tollefson (2013) and Smith et al 2007; 2012. Slightly modified from original version retained here to show hindcast in dotted red.
As Whitehouse had reported, there is indeed a quite dramatic decrease between the 2011 (green) and 2012 (blue) versions of the UK Met Office decadal forecast. There is also a considerable shortening of the period of the forecast, with the later forecast ending in 2017. I was puzzled by some of these differences at the time and requested digital versions of both the old (2011) and new (2012) decadal forecasts. The Met Office were cordial and responsive to the request – the complete opposite of the gnomes of Norwich. I had meant to write a post at the time, but became very distracted by some personal issues.
The 2012 decadal forecast used a newer model (HadGEM3) than the 2011 forecasts (HadCM3) and that HadGEM3 was much more computation-intensive. As a result, there were fewer runs (10 vs 20) and only a shorter time period (5 years vs 10 years.) The Met Office stated:
The 2012 prediction is the first to use the Met Office’s latest experimental decadal prediction system, based on HadGEM3. This includes a comprehensive set of improvements based on the latest scientific understanding. HadGEM3 has been thoroughly tested and has more accurately reproduced temperature variations over the past few decades, suggesting it shows greater skill than was available from previous decadal forecast systems.
The UK Met Office’s contributions to IPCC AR5 were based on HadGEM2, an earlier version. On the basis that this contribution was probably made in late 2009 or early 2010, I’ve estimated that the “forecast” starts in 2010 (as shown below.)
Nature “News”, 2013
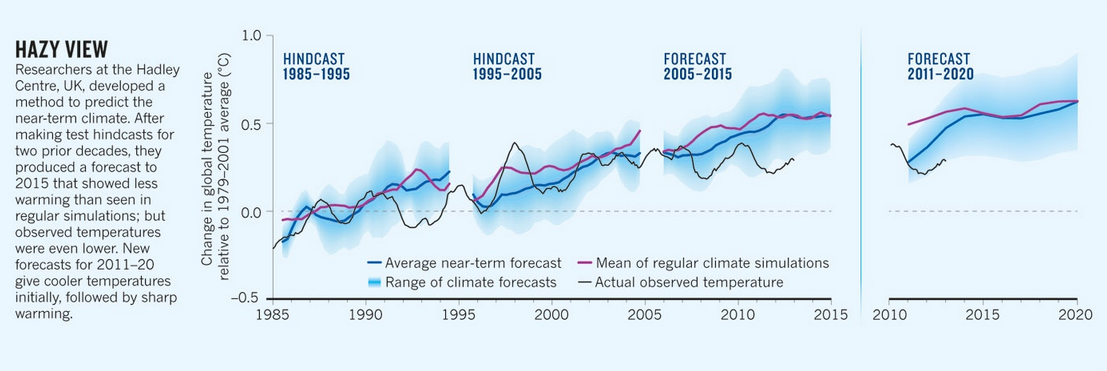
The figure shown below is the lead graphic to Tollefson’s Nature News article “The forecast for 2018 is cloudy with record heat.” I’ve verified that the left panel is re-drawn from a 2007 article by Met Office’s Doug Smith (Smith et al 2007(Science); the right panel appears to be a re-drawing of a similar diagram in Smith et al 2012 (Clim Dyn). Tollefson observed that Smith’s revised forecasts call for sharp increases in temperature in the next few years.
As will be shown below, the decadal forecast shown by Nature News is not the most recent Met Office decadal forecast, but a variation of the older 2011 forecast (the contemporary multi-model mean of Smith et al 2012). In addition, what Nature News has captioned “regular simulations” are not the Met Office contributions to IPCC (HadGEM2), but variations of the HadCM3 model used in the older decadal forecasts.
Figure 2. From Tollefson, Nature, July 10, 2013. Click to enlarge.
Reconciliation
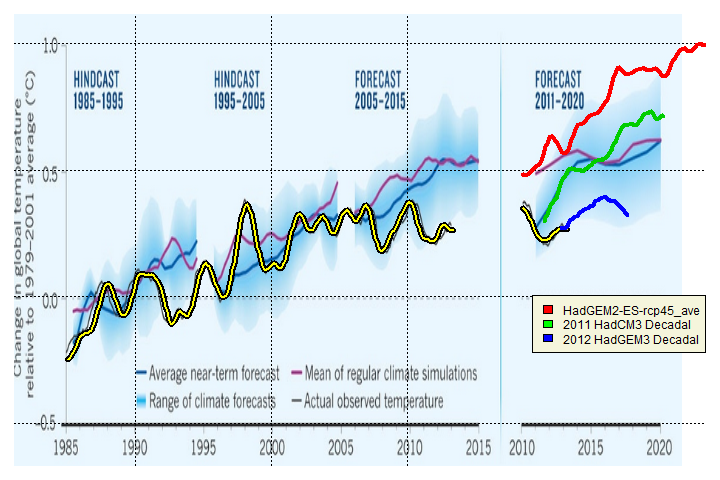
In the next graphic, I’ve overlaid the three forecasts from the three different models onto the Nature News graphic.
Figure 3. Overlay of three models onto Nature News graphic. Red, blue, green as in Figure 1. Smoothing is Gaussian 25-point.
The decadal forecast illustrated by Nature News, derived from Smith et al 2012, is a multi-model mean of various models, but is similar to the 2011 decadal forecast (green).
Second, the “regular simulations” (purple in the underlying graphic) are not nearly as warm as the CMIP5 contribution (HadGEM2-ES RPC45 average shown here).
Third, the most recent decadal forecast using HadGEM3 is substantially cooler than the previous 2011 decadal forecast (HadCM3) and much cooler than the IPCC contribution (HadGEM2). But by failing to show the current Met Office decadal forecast, Nature News has, to borrow a phrase, hidden the decline in near-term Met Office decadal forecasts.
While most of the discussion arising from Whitehouse’s original article pertained to past trends, surely the revisions in Met Office decadal forecasts is far more interesting. Why are forecasts from the computationally-intensive HadGEM3 so much lower than the corresponding forecasts from HadGEM2? What did longer HadGEM3 runs show? Did they show also show reductions from HadGEM2?
Postscript: Whitehouse’s original article prompted a contemporary discussion of the “statistical significance” of recent trends – a topic that I generally avoid as hackneyed and which I do not propose to discuss today other than the following brief comment. In the contemporary exchanges between Whitehouse and Greenpeace columnist Ward, there was an elision between HadCRUT3 and HadCRUT4, where each side used the version more favorable to their point. Between 1997 and the most recent observation, HadCRUT3 has had no trend whatever: 0.0085 deg/decade. Unlike HadCRUT3, HadCRUT4 has a slight trend over the same period (0.045 deg/decade with adjusted t-value of 2.2). Interestingly, the difference between the two versions, though less, is even more “statistically significant” (0.0370 deg C/decade with a t-value, after adjustment for AR1 correlation, of 4.01). The important issue is whether models are running too hot – an issue which can exist even if there is a “statistically significant” trend (but one that is lower than predicted by the models). I request that commenters limit their commentary to discussion of the changes in model and refrain from attempting to comment on statistical significance on trends.
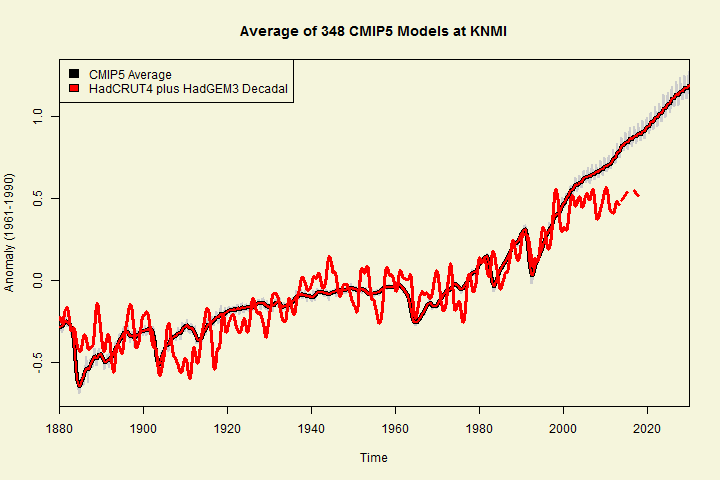
Update July 15: The Met Office contribution to CMIP5 is comparable to the average of the 348 CMIP5 series on file at KNMI, as shown below: