by Judith Curry
Part II: what causes variations and changes in hurricane activity?
4. Detection and attribution of changes in hurricane activity
If oceans are getting warmer as a result of climate change, so the argument goes, surely hurricane activity must increase as a result, particularly hurricane intensity. However, most of the assessment reports cited in Chapter 1 have low confidence in attributing any recent changes in hurricane activity to manmade global warming.
What is the scientific basis for assessing whether or not manmade global warming is causing a change in hurricane activity?
Detection and attribution of manmade signals in in the climate system is a new and rapidly developing field. Attributing an observed change or an event partly to a causal factor (such as manmade climate forcing) normally requires that the change first be detected. A detected change is one that is determined, based on observations to be very unlikely to occur (less than about a 10% chance) due to natural internal variability alone. An attributable change implies that the relative contribution of causal factors has been evaluated, along with an assignment of statistical confidence.
There are some situations whereby attribution without detection statements can be appropriate, although lower confidence is assigned when attribution is not supported by a detected change. For example, a trend analysis for an extremely rare event may not be meaningful. Including attribution without detection in the analysis of climate change impacts reduces the chance of a false negative -incorrectly concluding that climate change had no influence on a given extreme events. However, attribution without detection comes at the risk of increasing the rate of false positives – incorrectly concluding that manmade climate change had an influence when in fact it did not.
The conceptual framework for most detection and attribution analyses consists of four elements:
- time history of relevant observations
- the estimated time history of relevant climate forcings (such as greenhouse gas concentrations or volcanic activity)
- an estimate of the impact of the climate forcings on the climate variables of interest
- an estimate of the internal (unforced) variability of the climate variables of interest—e.g. natural unforced variations of the ocean, atmosphere, land, cryosphere, in the absence of external forcings.
Paleoclimate proxies from the geological record are useful for detection studies in providing a baseline against which to compare recent variability of the past century or so. Time of emergence is the time scale on which climate change signals will become detectable in various regions – an important issue, since natural variability can obscure forced climate signals for decades, particularly for smaller space scales.
4.1 Detection
There are three main challenges to detecting a signal of changed hurricane activity:
- very long timescales in the oceans, resulting in substantial lag time between external forcing and the realization of climate change and its impacts
- high-amplitude natural internal variability in the ocean basins on time scales from the interannual to the millennial
- strong regional variations, both in ocean circulation patterns and hurricane activity.
Based on the observations summarized in Chapter 3, the following summary is provided regarding the detection of changes in global or regional hurricane activity:
- global hurricane activity: small but insignificant trends of decreasing hurricane frequency and increasing number of major hurricanes;
- global % of Category 4/5 hurricanes: increasing trend since 1970, although the data quality for the period before 1988 is disputed.
- rate of intensification: hints of a global increase, although data sets disagree.
- track migration: poleward migration of the average latitude where hurricanes have achieved their lifetime-maximum intensity for 1982-2012.
- Atlantic hurricanes: increasing trends since 1970, but comparable activity was observed in the 1950’s-1960’s.
- hurricanes in other regions: observational record is too short, but no evidence of trends that exceed natural variability
The observational database (since 1970 or even 1850) is too short to assess the full impact of natural internal variability associated with large-scale ocean circulations. Paleotempestology analyses indicate that recent hurricane activity is not unusual.
4.2 Sources of variability and change
In the absence of detecting any significant change in global or regional hurricane activity, attribution methods without detection statements must be used. These methods require assessing the contributions to climate variability/change from external forcing (e.g. CO2, volcanoes, solar) plus natural internal variability associated with the large-scale ocean circulations. In two-step attribution methods, changes in intermediate variables (such as sea surface temperature, wind shear, atmospheric humidity) are useful in identifying physical mechanisms whereby warming might contribute to a change in hurricane activity.
The focus in this section is on identifying sources of variability and change during the period since 1850, when historical data is available.
Many of the arguments surrounding an increase in hurricane activity are associated with increases in global sea surface temperature. Figure 4.1 shows the variability of globally-averaged sea surface temperature (SST) since 1850, along with external forcing from CO2, volcanoes, and the sun.
It is seen from Figure 4.1a that sea surface temperature (SST) reached a global low point in 1910, and then increased rapidly until about 1945. The elevated Atlantic hurricane activity in the 1930’s-1950’s (Section 3.3) occurred when the global SSTs were ~0.8oC cooler than present global average SSTs. This warming period was followed by a period of slight cooling until 1976, after which temperatures began increasing.
Figure 4.1 (top) Ocean surface temperature anomalies (oC) From HadSST. (middle) Human-caused carbon dioxide emissions Source: IPCC AR5. (bottom) Annual mean time series of climate forcing agents:
atmospheric CO2 concentration, stratospheric aerosols (volcanic eruptions), total solar irradiance, and tropospheric aerosols Source: Hegerl et al. (2018)
The global ocean warming during the period 35-year period from 1910 to 1945 of 0.6oC was comparable to the 0.7oC warming observed between the 42-year period between 1976 and 2018.
Regarding the recent warming, the IPCC AR5 made the following attribution statement:
- “It is extremely likely that more than half of the observed increase in global average surface temperature from 1951 to 2010 was caused by the anthropogenic increase in greenhouse gas concentrations and other anthropogenic forcings together. The best estimate of the human- induced contribution to warming is similar to the observed warming over this period.”
In other words, the IPCC AR5 best estimate is that all of the warming since 1951 has been caused by humans.
So, what caused the early 20th century global warming? This issue has received remarkably little attention from climate scientists. Lack of an explanation for the early 20th century global warming diminishes the credibility of the attribution statement for warming since 1951.
The first substantive attribution analysis of the early 20th century warming was made in a recent paper by Hegerl et al. (2018), which came to the following conclusion:
“Attribution studies estimate that about a half (40–54%) of the global warming from 1901 to 1950 was forced by a combination of increasing greenhouse gases and natural forcing, offset to some extent by aerosols. Natural variability also made a large contribution. The exact contribution of each factor to large-scale warming remains uncertain.”
Hegerl et al. (2018) provides a summary of forcing from CO2, volcanoes and solar (Figure 4.1c). In 1910, the atmospheric CO2 concentration has been estimated to be 300.1 ppm; in 1950 it was 311.3 ppm; and in 2018 it is 408 ppm. So, the warming during the period 1910-1945 was associated with a CO2 increase of 10 ppm, whereas a comparable amount of warming during the period 1950 to 2018 was associated with a 97 ppm increase in atmospheric CO2 concentration almost an order of magnitude greater CO2 increase for a comparable amount of global ocean warming.
Clearly, there were other factors in play besides CO2 emissions in the early 20th century global warming (Figure 4.1b). In terms of external radiative forcing, a period of relatively low volcanic activity during the period 1920-1960 would have a relative warming effect, although the period from 1945 to 1960 was a period of slight overall cooling. Solar forcing in the early 20th century is uncertain, with estimates of warming of varying magnitude, although the magnitudes are insufficient for solar to have been a major direct contributor to the early 20th century global warming.
Hegerl et al. (2018) analyzed the internal variability associated with ocean circulations during the period since 1900. They found that the unusual cold anomaly circa 1910 (Figure 4.1a) originated in the South Atlantic, and then spread globally in the subsequent decade, leading to cold anomalies in both Atlantic and Pacific.
This rarely-discussed cold period was followed by strong warming in the Northern Hemisphere, which was particularly pronounced in high latitudes. Hegerl et al. summarized some previous research that might account for mechanisms of the strong high latitude warming in the Northern Hemisphere, including multi-decadal ocean oscillations in large-scale ocean circulation patterns. However, gaps in data coverage particularly in the Indo-Pacific and Southern Oceans imply higher uncertainty during the early 20th century than for recent periods.
Hegerl et al. focus their arguments regarding internal variability associated with large-scale ocean circulations on the Atlantic Multidecadal Oscillation and the Pacific Decadal Oscillation. The Atlantic Multi-decadal Oscillation (AMO) is a coherent mode of natural variability of sea surface temperatures (SST) occurring in the North Atlantic Ocean, with an estimated period of 60-80 years. The Pacific Decadal Oscillation (PDO) is a recurring pattern of ocean-atmosphere climate variability of surface temperature centered over the northern hemisphere mid-latitude Pacific basin. Warm phases of the both the AMO and PDO contributed to warming particularly during the 1930’s and 1940’s.
As summarized in NCA4 (2017), observed multidecadal variability in the Atlantic Ocean surface temperatures has also been ascribed to Saharan dust outbreaks and manmade pollution aerosols.
4.3 Natural internal modes of variability
Disentangling the complex interplay between the many modes of internal variability associated with the large-scale ocean circulations is not at all straightforward. The multi-decadal modes (with timescales of 30 to 80 years) are of the greatest relevance in attribution analyses of 20th and early 21st century climate change. These multi-decadal modes are associated with regional-to-basin-scale oceanic circulation systems that define the dynamical memory of the climate system in the presence of fast, large-scale atmospheric processes. The faster atmospheric processes not only supply energy for the multi-decadal variability, but also provide the means for communication between the different ocean basis and synchronization of the multi-decadal climate modes (e.g. Wyatt and Curry, 2013; Kravtsov et al. 2018).
Hurricane activity is also influenced by multidecadal variability in the oceans in ways that do not directly rely on local changes in sea surface temperatures – such as changes in atmospheric circulation patterns and wind shear.
4.3.1 Atlantic modes and hurricane activity
Three modes of interannual to multi-decadal variability have been identified in the Atlantic:
- Atlantic Multidecadal Oscillation (AMO)
- North Atlantic Oscillation (NAO)
- Atlantic Meridional Mode (AMM)
Grossman and Klotzbach (2009) provide the following summary of the relationships among these three Atlantic modes. The cross-equatorial pattern associated with the AMM and the SST, sea level pressure (SLP) and wind patterns associated with the AMO can be viewed as one overall phenomenon that stretches from the high latitudes to the tropics. The AMO and AMM are also closely related to the NAO on multidecadal time scales. Long-term positive (negative) phases of the NAO coincide with the negative (positive) phase of the AMO and AMM, generally with a lag of several years. The NAO depends on the North Atlantic meridional temperature and pressure gradient, which in turn lessens (increases) as the North Atlantic warms (cools) with the positive (negative) AMO.
The most thoroughly studied of these modes with respect to Atlantic hurricanes is the AMO. The Atlantic Multidecadal Oscillation (AMO) is associated with basin-wide SST and sea level pressure (SLP) fluctuations. The positive (warm) AMO phase is associated with a pattern of horseshoe-shaped SST anomalies in the North Atlantic Figure 4.3), with pronounced warming in the tropical and parts of the eastern subtropical North Atlantic, an anomalously cool area off the U.S. East Coast, and warm anomalies surrounding the southern tip of Greenland.
Figure 4.3 Horseshoe pattern of the AMO, where the ‘Arc’ Index corresponds to the average sea surface temperatures inside the black contours. Source: Johnstone (2017).
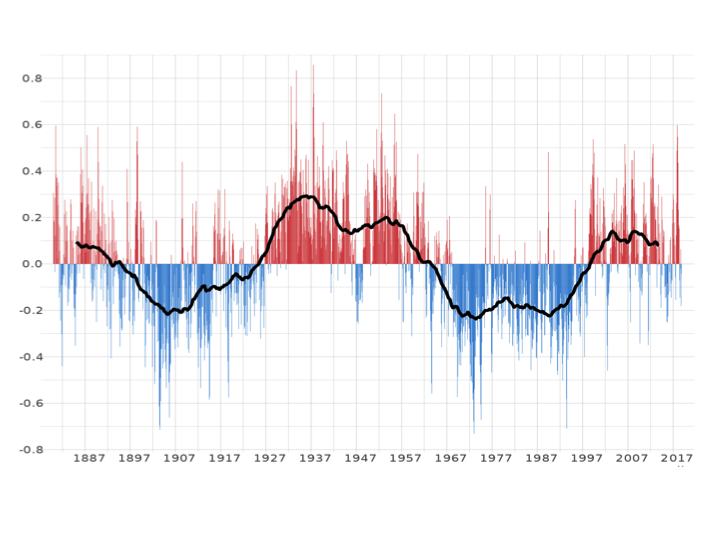
The traditional AMO index (Figure 4.4) is calculated from the patterns of SST variability in the North Atlantic once a linear trend has been removed. However, since the trend is significantly non-linear in time (Figure 4.1a), the detrending aliases the AMO index. The nonlinearity is particularly pronounced during the period 1945-1975, when global sea surface temperatures showed a slight cooling trend.
Figure 4.4. The Atlantic Multidecadal Oscillation (AMO) index showing positive (red) and negative (blue) phases. Source: https://commons.wikimedia.org/wiki/File:Atlantic_Multidecadal_Oscillation.svg
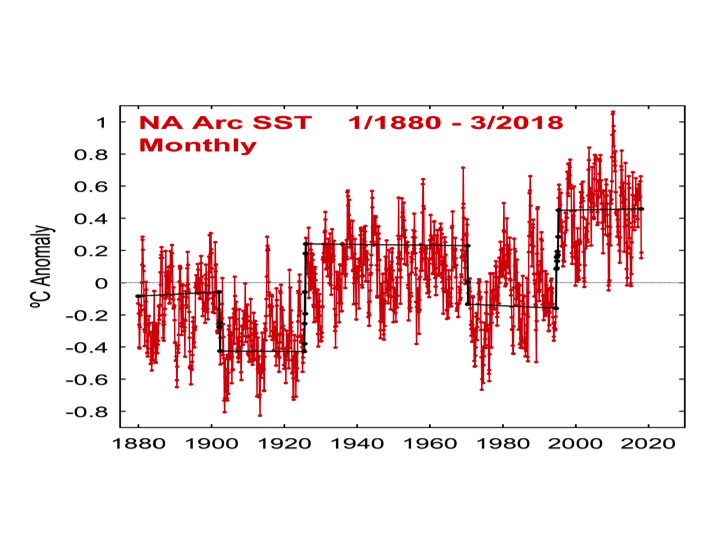
To avoid the problems associated with detrending, Johnstone (2017) developed an Arc Index version of the AMO Index, which is the average SST in the Arc region (Figure 4.3). The Arc Index (Figure 4.5) shows abrupt shifts to the warm phase in 1926 and 1995, consistent with the conventional AMO analysis in Figure 4.5. Johnstone’s analysis indicates a shift to the cold phase in 1971, which differs from the analysis shown in Figure 4.5 that indicates the shift to the cold phase in 1964. The revised AMO index of Klotzbach and Gray (2008) indicates a shift to the cold phase in 1970, consistent with the analysis of Johnstone.Figure 4.5 Arc Index version of the AMO. Source: updated from Johnstone (2017)
The main hurricane-relevant variables that change with the phase changes of the AMO, AMM and NAO are spatial patterns of SST (or oceanic heat content) and wind patterns. Hurricane genesis (formation) locations, tracks and intensification are temporally and spatially modulated by these large‐scale climate modes.
Atlantic hurricanes show strong variations on decadal and multidecadal time scales in the observed record (Figures 3.6 – 3.8). The greatest impact of the AMO is on the number of major hurricanes (Category 3+) and Accumulated Cyclone Energy, shown in Figure 4.6. The shift to the relatively inactive phase occurred around 1970/1971, in accord with the AMO analyses of Johnstone (2017) and Klotzbach and Gray (2008), with the late 1960’s still characterized by a larger number of major hurricanes and high ACE values. The relationship of the AMO to major hurricane activity in the Atlantic was identified by Goldenberg et al. (2001) to be associated with above normal SSTs and decreased vertical shear associated with the warm AMO.
Bell and Chelliah (2006) related the interannual and multidecadal variability of hurricane activity in the Atlantic to two tropical multidecadal modes in the Atlantic. Comparing periods of high activity in the Atlantic, they showed that the most recent increase in hurricane activity is related to the exceptionally warm SSTs in the Atlantic, while the high activity period in the 1950s and 1960s was more closely associated with the West African monsoon.
Figure 4.6 Observations of Atlantic hurricane activity since 1920. The warm phase of the Atlantic Multidecadal Oscillation is indicated by orange shading, with the cool phase indicated by purple shading. Top: Annual frequency of major hurricanes. Bottom: Annual frequency of Accumulated Cyclone Energy (ACE). Curry (2018c)
Lin et al. (2019) argue that there are two regimes of the AMO, which appear to be consistent with the analysis of Bell and Chelliah. Lin et al. argue that there are two separate AMO regimes: a 10-30 year regime (intrinsic to the Atlantic), and a 50-80 year regime (which is influenced by variability in the Pacific and the Greenland-Iceland-Norwegian Seas).
Vimont and Kossin (2007) related Atlantic hurricane activity to the Atlantic Meridional Mode (AMM). Hurricane genesis locations, SST and wind shear anomalies are influenced by the different phases of the AMM. During the positive AMM phase (above normal SSTs in the North Atlantic), there is an overall increase of hurricane activity in the Atlantic, with the mean genesis (formation) location shifting eastward and toward the equator. Also associated with a positive AMM is an increase in storm duration and the frequency of intense hurricanes (Kossin and Vimont 2007).
4.3.2 Pacific modes and hurricane activity
The El Niño – Southern Oscillation (ENSO) is a major mode of natural climate variability. ENSO is associated with sea surface temperature (SST) changes in the tropical Pacific, which is associated with shifts in the seasonal temperature, circulation, and precipitation patterns in many parts of the world. El Niño and La Niña (warm and cold) events usually recur every 3 to 7 years and tend to last for approximately a year.
ENSO has a strong impact on hurricanes, both in the Pacific and Atlantic Oceans.Figure 4.7 The various Niño regions where sea surface temperatures are monitored to determine the current ENSO phase (warm or cold) Source: Wikipedia
Kim et al. (2009, 2011) provide an overview of the impact of ENSO on tropical cyclones. In La Niña years, there are usually twice as many major hurricanes as in El Niño years. ENSO is generally thought to influence Atlantic hurricane activity by altering the large scale atmospheric circulation patterns for genesis (formation) and intensification. During an El Niño year, the vertical wind shear is larger than normal in most of the tropical Atlantic and especially in the Caribbean, which inhibits the formation of hurricanes.
The effect of ENSO on Pacific hurricanes is opposite to that in the Atlantic – El Nino years are associated with greater hurricane activity in the Pacific. As summarized by Kim et al. (2009a), ENSO has an impact on the mean hurricane genesis location in the Pacific, with a displacement to the southeast (northwest) in El Niño (La Niña) years. Because of this shift to the southeast, further away from the Asian continent, hurricanes in El Niño years tend to last longer and be more intense than in other years. ENSO also affects the shapes of the tracks in El Niño years, the hurricanes have a tendency to recurve northeastward and reach more northerly latitudes. Hence, hurricanes affect the southern South China Sea more frequently during La Niña years, but affect the Central Pacific more frequently in El Niño years.
Capotondi et al. (2015) address the issue of ENSO diversity, including the El Niño Modoki (a Japanese word that means ‘similar but different’). By contrast to the traditional El Niño that is associated with warming in the eastern tropical Pacific (Niño 1,2,3 regions in Figure 4.7), the El Niño Modoki is associated with warming in the central tropical Pacific (Niño 4 region). Kim et al. (2011) found that the El Niño Modoki shifts hurricane activity to the western Pacific, providing more favorable conditions for Asian landfalls, while hurricane activity in the eastern Pacific is substantially reduced. In the Atlantic, the impacts of an El Niño Modoki on hurricane activity more closely resemble a La Nina season, with elevated hurricane activity (Figure 4.8).Figure 4.8 Composites of Atlantic track density anomaly (multiplied by 10) during the August to October period for (A) El Niño, (B) El Niño Modoki, and (C) La Niña. Source: Kim et al. (2009)
In climate change attribution studies, multi-decadal modes are of greater relevance than the interannual variability associated with ENSO and Modoki events. However, there is evidence of multidecadal variability in the relative frequency of El Niño, La Niña and Modoki events. In the Pacific, two decadal to multi-decadal modes have been identified:
- Pacific Decadal Oscillation (PDO) – an envelope for ENSO activity
- North Pacific Gyre Oscillation (NPGO) – an envelope for Modoki activity
The Pacific Decadal Oscillation (PDO) is a pattern of Pacific climate variability (poleward of 20oN), with a decadal time scale that can be interpreted as a decadal envelope of ENSO variability. During a warm (positive) phase, the west Pacific becomes cooler and part of the eastern ocean warms; during a cool (negative) phase, the opposite pattern occurs (Figure 4.9).
The North Pacific Gyre Oscillation (NPGO; DiLorenzo et al. 2008) reflects variations in the strength of the central and eastern branches of the subpolar and subtropical ocean circulation patterns, and is driven by the atmosphere through the North Pacific Oscillation (NPO). The NPO spatial pattern consists of a dipole structure in which sea level pressure (SLP) variations in the central Pacific near 40°N oppose those over Alaska. Variations of the NPGO index are shown in Figure 4.10.Figure 4.9 PDO Index values. Source: http://research.jisao.washington.edu/pdo/Figure 4.10 NPGO Index values. Source: https://asl.umbc.edu/hepplewhite/cindex/
DiLorenzo et al. (2015) presents an integrated hypothesis for Pacific climate variability, whereby multi-decadal patterns of Pacific decadal variability (PDO, NPGO) are energized by the interaction of meridional (north-south) modes (e.g., NPO) and the zonal (east-west) modes (e.g., ENSO and Modoki).
Maue (2011) interpreted the global Accumulated Cyclone Energy (Figure 3.2) in terms of the PDO and NPGO. The Pacific climate shifts of 1976–77 and 1988–89 have been related to the PDO and North Pacific Gyre Oscillation (NPGO), respectively, which are seen in the global ACE time series. Decadal variations in the NPGO, which has been enhanced since 1989, have been linked to SST anomaly patterns that closely resemble El Niño Modoki events.
Camargo et al. (2010) summarized several studies that have examined the decadal and multidecadal variability of hurricane activity in the western North Pacific. The observational record in the western north Pacific is unreliable before the 1950s, and perhaps even before the 1970s. The occurrence of major hurricanes is modulated by ENSO and the Pacific Decadal Oscillation. The decadal variability of hurricane tracks has also been largely attributed to the Pacific Decadal Oscillation. The regions with the greatest decadal changes are the East China Sea and the Philippine Sea.
4.3.3 Does global warming change the internal modes of variability?
The internal modes of variability associated with the large-scale ocean circulations are often referred to as ‘oscillations.’ However, it is incorrect to view these oscillations as ‘cyclic,’ as their period and frequency tend to be somewhat irregular. In principle, because they are internal modes associated with the nonlinear dynamics of the coupled atmosphere-ocean system, a specific oscillation pattern can cease to exist or change its mode of variability.
Because the historical record is relatively short, particularly outside of the Atlantic Ocean, it is useful to consider paleoclimatic evidence of these oscillations.
Knudsen et al. (2011) showed that distinct, 55- to 70-year oscillations have characterized the North Atlantic ocean-atmosphere variability over the past 8,000 years, consistent with the AMO. Cobb et al. (2013) analyzed fossil coral reconstructions of ENSO spanning the past 7000 years. The corals document highly variable ENSO activity, with no evidence for a systematic trend in ENSO variance. Twentieth-century ENSO variance is significantly higher than average fossil coral ENSO variance, but is not unprecedented. Liu et al. (2017) found that, over the period 1190 – 2007 AD, equatorial temperatures in the Central Pacific (associated with El Nino Modoki) in the late 20th century were accompanied by higher levels of interannual variability than observed previously in this period.
The NCA4 (2017; Chapter 5) concluded that confidence is low regarding the impact of manmade global warming on changes to these internal modes associated with large-scale ocean circulation patterns.
4.4 Attribution – models
Extended integrations of global climate models in principle should allow for an assessment of the frequency, intensity, duration and tracks of hurricanelike features in the model simulations. Attribution of the impacts of manmade global warming on hurricane characteristics can then be assessed through comparing climate model simulations both with and without human impacts (e.g. CO2 and aerosol emissions).
A prerequisite for using global climate models for attribution analyses or 21st century projections of hurricane activity requires that historical climate model simulations accurately simulate hurricane characteristics and interannual to decadal variability. However, simulation of realistic hurricane characteristics is hampered by the coarse resolution generally required of such global models and also the model treatment of tropical convection and clouds (e.g. Camargo et al 2008; Walsh et al. 2015). Further, climate models do not accurately simulate the timing and patterns of the multi-decadal oscillations (e.g. Kravtsov et al. 2018).
A number of new, high-resolution simulations of the
generation of hurricanes by global climate models have been performed in recent years (see Walsh et al. 2016 for a summary). More realistic maximum hurricane intensities have been simulated by downscaling individual storm cases from a coarse grid global model into a regional high resolution hurricane prediction system.
As a recent example, Patricola and Wehner (2018) used a high-resolution model to simulate 15 hurricane events from the global historical record. Simulations for each storm were conducted under current climate conditions versus the surface climate associated with pre-industrial conditions. They found that, relative to pre-industrial conditions, climate change has enhanced the average and extreme rainfall of hurricanes Katrina, Irma and Maria by 4%–9% and increased the probability of extreme rainfall rates, suggesting that climate change to date has already begun to increase tropical cyclone rainfall.
The model used by Patricola and Wehner (2018) was driven by specified sea surface temperatures, and did not include coupling to the ocean. Lack of ocean coupling in the model can lead to tropical cyclones that are more intense and frequent compared to slab–ocean and fully coupled atmosphere–ocean simulations. Tropical cyclone winds typically induce a ‘cold wake’ of upper-ocean temperatures. The cold wake can reduce the tropical cyclone intensity, depending on the tropical cyclone’s intensity and translation speed and the ocean heat content and salinity structure. Further, these simulations of individual storms only include the thermodynamic (temperature) related aspects of climate change, and do not include the impact of any atmospheric or ocean circulation changes that might be associated with global warming.
In one of the most sophisticated model-based attribution studies to date, Bhatia et al. (2019) investigated the issue of whether hurricane rates of intensification are increased by global warming. They compared the observed trends to natural variability in bias-corrected, high-resolution, global coupled model experiments that accurately simulate the climatological distribution of tropical cyclone intensification. Their results suggest a detectable increase of Atlantic intensification rates with a positive contribution from manmade forcing and reveal a need for more reliable data before detecting a robust trend at the global scale. The paper concludes that the study is limited by the ability of a climate model to accurately represent natural variability as well as the uncertainty around the trends in relatively short observational records. Further analysis with additional high-resolution climate models and a longer and more reliable observational record is required to confirm these conclusions.
In summary, global climate models are currently of limited use in hurricane attribution studies. High-resolution models used to simulate individual hurricanes are being used to perform controlled experiments that focus on specific events and the complexities of relevant physical processes. However, definitive conclusions regarding the impact of manmade warming on hurricanes cannot be determined from these simulations, given the current state of model development and technology.
4.5 Attribution – physical understanding
Our knowledge of the relationships between climate variability and hurricanes comes mainly from the analysis of historical data. Meaningful interpretation of these relationships requires understanding of the mechanisms that determine these relationships, but ultimately this understanding is limited by the same fundamental factors that limit our understanding of the mechanisms of the formation and intensification of individual hurricanes (see Emanuel 2018 for a review of current knowledge of hurricane processes).
4.5.1 Genesis
While there are some theories for hurricane genesis (formation), there is no quantitative theory that relates the probability of genesis to the large-scale environmental conditions. As summarized by Camargo et al. (2008), we have known for decades that sea surface temperature, vertical wind shear, and atmospheric humidity influence genesis, and this gives us an empirical basis for understanding how climate variations influence hurricane numbers.
As summarized by Walsh et al. (2015), the number of hurricanes appears
to be related to changes in the mean vertical circulation of the atmosphere. Research indicates that thermodynamic variables (related to temperature and humidity) are generally more important than atmospheric circulations for hurricane formation in the North Atlantic. Humidity in the lower atmosphere was shown to be the most important controlling parameter for formation in the Atlantic, with sea surface temperatures and cyclonic circulations patterns, wind shear and rising motion also being important.
The problem of understanding the impact of global warming on hurricane genesis is complicated by potentially compensating influences of a warming climate on hurricanes (e.g. Patricola and Wehner, 2018). Increasing sea-surface temperature (SST) are expected to intensify tropical cyclones. However, projected increases in vertical wind shear could work to suppress tropical cyclones regionally.
As summarized by IPCC AR5 (2013; Chapter 16), hurricanes can respond to manmade forcing via different and possibly unexpected pathways. For example, increasing emissions of black carbon and other aerosols in South Asia has been linked to a reduction of SST gradients in the Northern Indian Ocean, which has in turn been linked to a weakening of the vertical wind shear in the region and an observed increase in the number of intense hurricanes in the Arabian Sea. In the North Atlantic, the reduction of pollution aerosols is linked to tropical SST increases, while in the northern Indian Ocean, increases in aerosol pollution have been linked to reduced vertical wind shear – both of these effects have been related to increased tropical cyclone activity.
4.5.2 Intensification
The causal chain for global warming to increase hurricane intensity has long been argued to occur via the increase in sea surface temperature (SST) (e.g. Curry et al. 2006). Hoyos et al. (2006) showed that the trend of increasing numbers of category 4 and 5 hurricanes for the period 1970-2004 is directly linked to the trend in sea-surface temperature; other aspects of the tropical environment, although they influence shorter-term variations in hurricane intensity, do not contribute substantially to the observed global trend.
A nominal SST threshold of 26.5oC [80 oF] has been used as a criterion for the formation of hurricanes, and a threshold of 28.5oC [82.4 oF] for intensification to a major hurricane (Category 3+). New insights into the relationship between warming and hurricane intensity are provided by Hoyos and Webster (2011). During the 20th century, tropical ocean SST has increased by about 0.8°, accompanied by a steady 70% expansion of the ocean warm pool area that encompasses the regions exceeding 28oC [82.4 oF]. However, the region of tropical cyclogenesis has not expanded, owing to the area of convective activity remaining nearly constant. Hoyos and Webster argue that the temperature threshold for tropical cyclogenesis increases as the average tropical ocean temperature increases. The increasing intensity of atmospheric convection with warmer temperatures seems to be the link between SST increase and hurricane intensity, rather than the absolute value of the SST itself. Further, the location of the intense convection is related to the difference between the local SST and global tropical average SST, rather than to the absolute value of the SST itself (Vecchi et al. 2008). This variation in the threshold temperature for hurricane formation and intensification is consistent with the existence of very intense hurricanes even when the climate was significantly cooler.
The causal link between SST and hurricane plays a prominent role in theories to estimate the upper bounds on tropical cyclone intensity that indicate that there is a strong relationship between ocean thermal energy and the maximum potential intensity that can be achieved. Potential intensity is defined as the maximum sustainable intensity of a hurricane based on the thermodynamic state of the atmosphere and sea surface. The theories of potential intensity continue to be challenged and refined. Knutson and Tuleya (2004) estimated the rough order of
magnitude of the sensitivity of hurricane maximum intensity to be
about 4% per degree C of SST warming. Such sensitivity estimates have considerable uncertainty, as shown by a
subsequent assessments.
4.5.3 Rainfall
As the ocean surface warm, more water evaporates and a warmer atmosphere has a greater capacity to hold water vapor. Simple thermodynamic calculations show that there is about 7% more water vapor in saturated air for every 1°C [2 oF] of ocean warming (e.g. Trenberth, 2007).
This increase in atmospheric water vapor can cause an even larger increase in hurricane rainfall, since water vapor retains the extra heat energy required to evaporate the water, and when the water vapor condenses into rain, this latent heat is released.
4.6 Conclusions
Models and theory suggest that hurricane intensity and rainfall should increase in a warming climate. There is no theory that predicts a change in the number of hurricanes or a change in hurricane tracks with warmer temperatures.
Convincing attribution of any changes requires that a change in hurricane characteristics be identified from observations, with the change exceeding natural variability.
The global percent of Category 4/5 hurricanes has been observed to be increasing, although the amount of the increase depends on period considered, with questionable observations in some regions prior to 1987. Because of the short length of the data record, attribution of any portion of this increase to manmade global warming requires careful examination of the data and modes of natural variability in each of the regions where hurricanes occur.
While theory and models indicate that hurricane rainfall should increase in a warming climate, satellite-based observational analyses of hurricane rainfall have not addressed this issue on a meaningful spatial or temporal scale.
There is some evidence for a slowing of tropical cyclone propagation speeds globally over the past half century, but these observed changes have not yet been confidently linked to manmade climate change.
While substantial increases in Atlantic hurricane activity have occurred since 1970, these increases are likely driven by changes in the Atlantic Multidecadal Oscillation (AMO) and Atlantic Meridional Mode (AMM). Climate model simulations suggest a recent increase in the rate of intensification of Atlantic hurricanes that exceeds what can be expected from natural internal variability.
If manmade global warming is causing an increase in some aspect of hurricane activity, this increase should be evident globally, and not just in a single ocean basin. One problem is that data is insufficient for detection on the global level. When considering a single ocean basin, correct interpretation and simulation of natural internal variability is of paramount importance; unfortunately our understanding and ability to correctly simulate natural internal variability with global climate models is limited.
In summary, the trend signal in hurricane activity has not yet had time to rise above the background variability of natural processes. Manmade climate change may have caused changes in hurricane activity that are not yet detectable due to the small magnitude of these changes compared to estimated natural variability, or due to observational limitations. But at this point, there is no convincing evidence that manmade global warming has caused a change in hurricane activity.
JC note: stay tuned, next two posts will be on landfalling hurricanes.