In today’s post, I’m going to discuss an important new 1000-year chronology from northern treeline spruce in Quebec (Gennaretti et al 2014, PNAS here). The chronology is interesting on multiple counts. This is the first Quebec northern treeline chronology to include the medieval warm period. Second, it provides a long overdue crosscheck against the Jacoby-D’Arrigo chronologies (including Gaspe) that have been embedded in a number of canonical reconstructions. Its results are very different. Third, the Quebec (and Labrador) northern treeline is the closest treeline to the Baffin Island ice core and varve thickness series. I’ve observed on several occasions that interpretation of Baffin Island varve thickness series (Big Round Lake) is presently inconsistent with the interpretation of the similar Hvitarvatn series in Iceland and, in my opinion, there are serious questions about whether PAGES2K has oriented this series correctly.
Gennaretti et al Reconstruction/Chronology
The Gennaretti temperature reconstruction is based on a very large collection of living and subfossil black spruce from the latitudinal treeline. It extends back through the MWP to 918AD and continues forward to 2011. Their reconstruction shows a very elevated MWP, with the most extreme cold occurring in the early 19th century. It shows a relatively cool 20th century with a sharp increase in the 21st century. The Gennaretti reconstruction is linear in the underlying tree ring chronology. In the figure below, I’ve compared it to (arguably) the two most influential previous tree ring chronologies from Quebec – two versions of the Gaspe chronology: as used in Jacoby and D’Arrigo (1989), Mann et al 1998 and Mann et al 2008 (red); and a variation used in D’Arrigo et al 2006 (green). Both chronologies showed much reduced growth in the early 19th century (with Gennaretti being even more intense). But the Gaspe chronology (in both variations) was at hockeystick peak in 1980 (dotted red line),whereas the Gennaretti chronology was still below its long-term mean in 1980, only recovering above its long-term mean in the 21st century (see dotted black line at 2000).
Figure 2. Quebec Tree Ring Chronologies. All scaled to SD Units. Black – Gennaretti et al 2014 black spruce from northern treeline. Red- Gaspe chronology used in Jacoby and D’Arrigo 1989 NH reconstruction and in Mann et al 1998. Green – Gaspe chronology incorporating additional measurements from the mid-1980s as used in D’Arrigo et al 2006.
Comparison to Varve Series
Gennaretti et al compared their results to recent analyses by Gifford Miller, the lead author of the Hvitarvatn varve thickness series that has been much discussed at CA recently, a discussion that presumably led to PAGES2K’s remarkable decision to invert the orientation of the series in their reconstruction. Miller has also done important work on Baffin Island, the interpretation of which (especially the Big Round Lake varve thickness series) has become a bit of a battleground issue. Gennaretti et al also compare their interpretation to some other Quebec data (e.g. ice wedges on Hudson Strait) that I am not familiar with, but plan to examine.
Miller had interpreted Baffin Island to have had a medieval warm period to about 1250AD (“ice melt” in diagram below), with a subsequent period of relative cold (“continuous ice cover” in the diagram below) commencing about 1450 and continuing into the 20th century. Gennaretti’s reconstructed medieval warmth neatly matched Miller’s period of “ice melt” on Baffin Island.
Figure2. Gennaretti et al 2014. Northern Quebec tree ring temperature reconstruction (blue), compared to Gifford Miller’s Baffin Island interpretation.
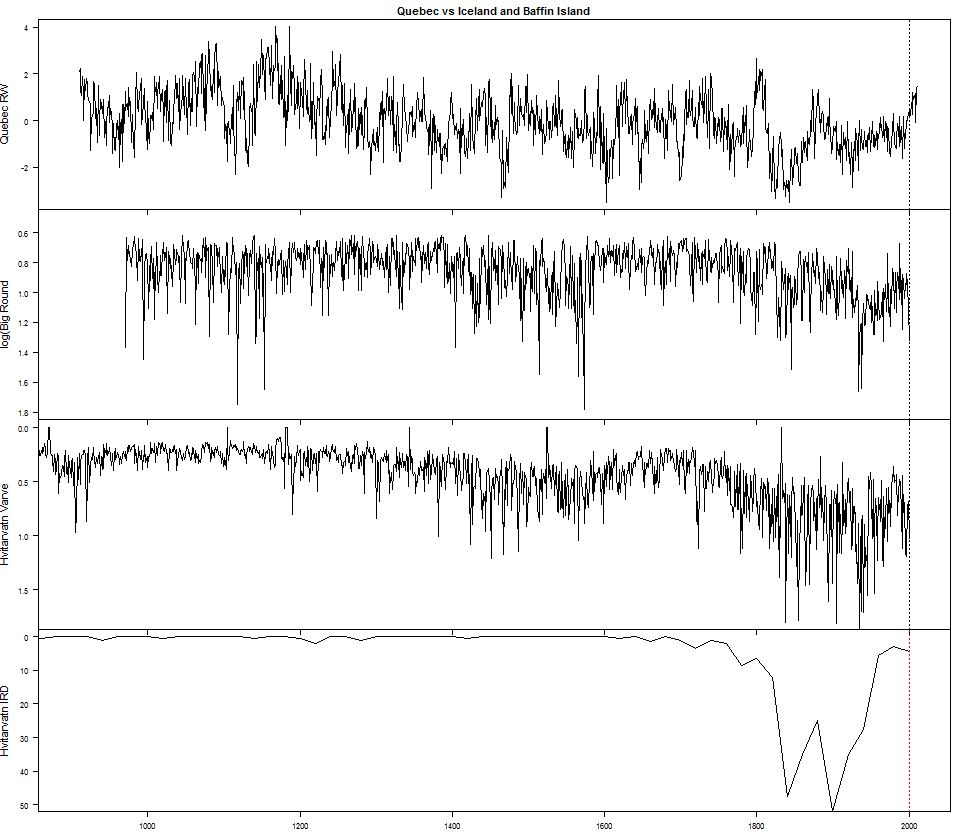
The next graphic compares the Gennaretti reconstruction from Quebec (top panel) to Miller’s Hvitarvatn, Iceland (inverted varve thickness – third panel and IRD (ice-rafted debris) bottom panel) and the Big Round Lake, Baffin Island varve thickness series (also inverted here and thus opposite to orientation of PAGES2K and numerous multiproxy studies.
Figure 3. Top – Quebec northern treeline temperature reconstruction; middle – Big Round Lake varve thickness (logarithm), shown in inverted orientation - opposite to the orientation used in Kaufman et al 2009, PAGES2K, Ljungqvist 2010 and numerous other studies; bottom – Hvitarvatn, Iceland varve thickness, shown in inverted orientation, following interpretation of Miller et al 2012, advocated at Climate Audit here and finally applied in PAGES2K -2014 revision.
Looking first at the 19th century, Miller interpreted the association of thick 19th century varves together with IRD (ice-rafted debris) levels not seen since the LGM (Last Glacial Maximum) and thus interpreted thick varves as evidence of glacier advance and cold, rather than warmth, whereas thick varves had been interpreted in Kaufman et al 2009 and PAGES2K as evidence of warmth. Miller interpreted the thin medieval Hvitarvatn varves as evidence of glacier recession and warmth. Because thick varves require both that a glacier be nearby and that it be retreating, it appears that thin varves can be evidence of both warmth (glacier absence) and extreme cold and thus cannot be simply dumped into a multiproxy black box.
At Big Round Lake, Baffin Island, the period of above-average thick varves exactly match the periods of above-average thick varves at Hvitarvatn, Iceland. It also corresponds to the period designated by Miller (on other evidence) as cold (as shown in Figure 2 here). Interpretation of thick Baffin Island varves as evidence of warmth (as done in Kaufman et al 2009 and PAGES2K) requires either Miller’s interpretations at Iceland and Baffin Island be overturned or that some physical mechanism be provided for climate in Iceland and Baffin Island proceeding in symmetrically opposite directions over the course of the last millennium – a physics issue completely ignored by the PAGES2K authors.
The Quebec ring-width chronology shows lowest growth in the periods of relatively thick varves. Its correlation to Hvitarvatn varve thickness (inverted) is 0.33 – a value that is (in my experience) unusually high between unlike proxies. When one looks at the medieval period, one gets the impression that varve thickness series are “damped” in its upper register – logical enough since varve thickness cannot be less than zero. When Hvitarvatn varves are compared over the Holocene to other measures (e.g. BSi), one gets a similar impression of “damping” in the upper register.R
Comparison to PAGES2k-2013 and Hanhijarvi
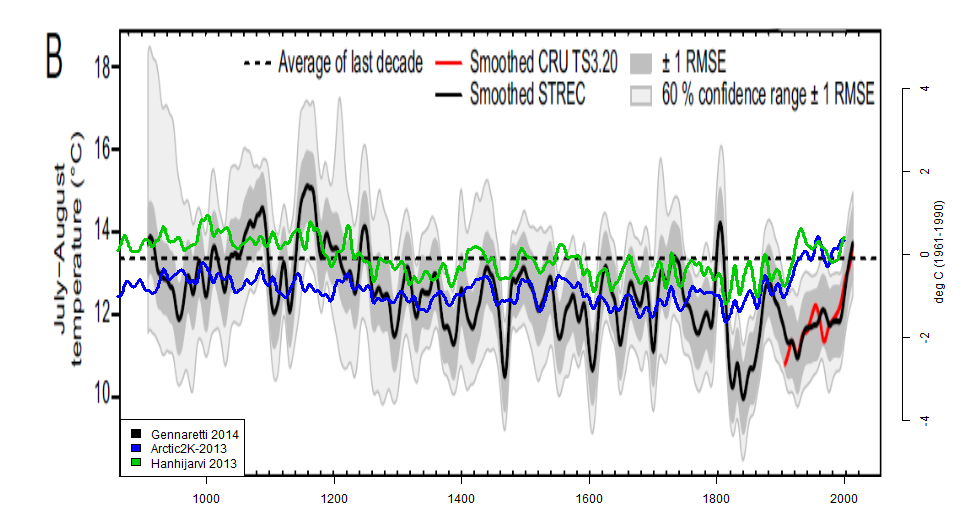
The next graphic overplots the PAGES2k-2013 Arctic reconstruction (blue – unrevised as used in AR5 – revised version not available digitally to date) and Hanhijarvi et al 2013 North Atlantic Arctic reconstruction (green) onto the Gennaretti reconstruction in Quebec. The amplitudes are much greater. In addition, the 20th century levels in the Gennaretti reconstruction are substantially lower than medieval levels, even as compared to Hanhijarvi et al 2013. To the extent that this expands the regional coverage of Hanhijarvi, it would not move it in the direction of PAGES2K-2013, but in the opposite direction.
Figure 4. Comparison of Gennaretti 2014 reconstruction (black) to PAGES2k-2013 (pre-revision in blue) and Hanhijarvi et al 2013 (green).
Discussion
Gennaretti’s ring width chronology reinforces the impression from Hvitarvatn and other Gifford Miller analysis of the early 19th century as a period of extreme relative cold and of an actual medieval warm period. It further supports my previous argument that the Big Round Lake varve thickness series (used in numerous multiproxy studies, including PAGES2K) has been incorrectly oriented and needs to be inverted. Re-examining the underlying article (Thomas et al 2009), the original authors report that they “do not know whether greater changes in glacier position occurred from 1000 to 1900 AD that would have influenced the Big Round Lake varve record”. Major changes in glacier position have been documented in Baffin Island during the Little Ice Age. Given that such changes are believed by Miller to be the driving force behind the very similar Hvitarvatn record, it seems far more plausible that changes in Baffin Island glacier position have wrought similar effects at Big Round Lake than that such changes can be disregarded.
As Hodder et al. (2007) point out, factors other than temperature can influence varve thickness. Leonard (1997) demonstrated that changes in glacier activity and position relative to the lake influence varve thickness. The Big Round Lake varve record is probably not influenced by changes in glacier position, at least during the twentieth century. The maximum Holocene extent of the glacier was likely attained in the late nineteenth century (Briner et al. in press). The glacier remained at this maximum position until the mid-twentieth century (Fig. 1b) and has retreated *250 m since 1960 AD, a small distance compared to the size of the glacier (*2 km across) and the 5-km-long proglacial stream. We cannot determine pre-twentieth-century glacier position, however, and therefore do not know whether greater changes in glacier position occurred from 1000 to 1900 AD that would have influenced the Big Round Lake varve record. This adds uncertainty to our varve-inferred temperature reconstruction prior to the twentieth century. Furthermore, we cannot determine changes in subglacial sediment storage that would influence varve thickness. The sedimentation regime in Big Round Lake changed dramatically around 970 AD (58 cm depth in the long core). Neoglaciation initiated on Baffin Island *3 ka (Briner et al. in press), and the glacier likely was farther from the lake before this time. The distance between the glacier and Big Round Lake likely was changing around 970 AD, and may have caused the change in sedimentation at the lake.
We’ve already seen that inversion of Hvitarvatn had a major impact on the PAGES2K Arctic reconstruction. Inversion of Big Round Lake would likely have a similar impact.
The Gennaretti reconstruction also raises questions about the longstanding use of the Gaspe chronology without any apparent attempt at verification. In McIntyre and McKitrick 2005, we noted many issues about the validity of this series as a temperature proxy. Gaspe is well south of the northern treeline, which had spruce chronologies rather than cedar. Prior to our 2005 studies, Ross and I met with two of the leading cedar specialists in Canada and were considerably influenced by their botanical view that cedar growth was best in cool, moist years. We also observed that other cedar chronologies, including a nearby cedar series in Maine, did not have a comparable shape. We also learned that there had been additional measurement information from Gaspe, which Jacoby and D’Arrigo refused to provide. We also sought exact information on where the Gaspe samples had been taken, with the information once again being refused. The northern treeline reconstruction of Jacoby and D’Arrigo 1989 used only the 10 most “temperature-sensitive” sites of 35. Jacoby (recently deceased) refused to archive the information from the other 25 sites on the following grounds:
If we get a good climatic story from a chronology, we write a paper using it. That is our funded mission. It does not make sense to expend efforts on marginal or poor data and it is a waste of funding agency and taxpayer dollars. The rejected data are set aside and not archived.
At the NAS panel in 2006, D’Arrigo created quite a sensation when, as I reported at the time, she “put up a slide about “cherry picking” and then she explained to the panel that that’s what you have to do if you want to make cherry pie”.
The PAGES2K study used 13 tree ring chronologies: four Jacoby-D’Arrigo chronologies from North America and three Briffa chronologies from Asia (including the Yamal superstick of Briffa et al 2008). The HSI of these seven chronologies (1.56) is much higher than the HSI (0.56) of the other five authors. I, for one, would find their work more convincing if it were replicated by independent groups. That their Quebec were not replicated in the much more comprehensive study of Genarretti et al 2014 is hardly reassuring.
Postscript
Comparison to Wilson 2007 NQU
In comments below, Rob Wilson observed that Wilson et al (2007) contained a northern Quebec (NQU) chronology and suggested a comparison, provided below. Wilson’s NQU chronology is based on an old Fritts series (Fort Chimo) and still unarchived data for Pyramid and Lac Tesaliuk, both sites attributed to Payette (2007), though only the former site is mentioned in the article. Both chronologies are sort-of similar through from 1775-1915 or so, but the Wilson chronology has a much more pronounced pulse in the 20th century and more of a divergence problem.
Examining Payette (2007), it appears that even nearby site chronologies can have very different patterns, depending on regeneration. It’s not evident to me that you can average such incommensurate series in any reasonable way. Payette 2007 has some interesting pictures showing subfossil trees above the present treeline, reminiscent of Polar Urals.
Comparison to D’Arrigo et al 2006 Labrador
Here is a similar comparison of the new Gennaretti chronology to the D’Arrigo et al 2006 Labrador RCS chronology. This is related to the Labrador STD chronology shown in their 2003 article, but isn’t the same. While there are points of similarity in the early 19th century, the D’Arrigo RCS version shows much weaker growth in the downticks around 1600 and 1700, and has a very large growth pulse in the mid-20th century that is not observed in the Gennaretti data. One of the issues that concerns me about the D’Arrigo 2006 LAB chronology is that inhomogeneity between sites appears to be expressed in the chronology – a very difficult and perhaps insurmountable issue with RCS methods.
Reference:
Gennaretti, F et al (2014. Volcano-induced regime shifts in millennial tree-ring chronologies from northeastern North America, PNAS. pdf NOAA data
Thomas et al 2009. Climate of the past millennium inferred from varved proglacial lake sediments on northeast Baffin Island, Arctic Canada pdf
Payette 2007. Contrasted dynamics of northern Labrador tree lines caused by climate change and migrational lag. pdf