by Javier
By knowing or estimating where in the solar cycle we are we can get an estimate of the chances of a particular outcome even years ahead.
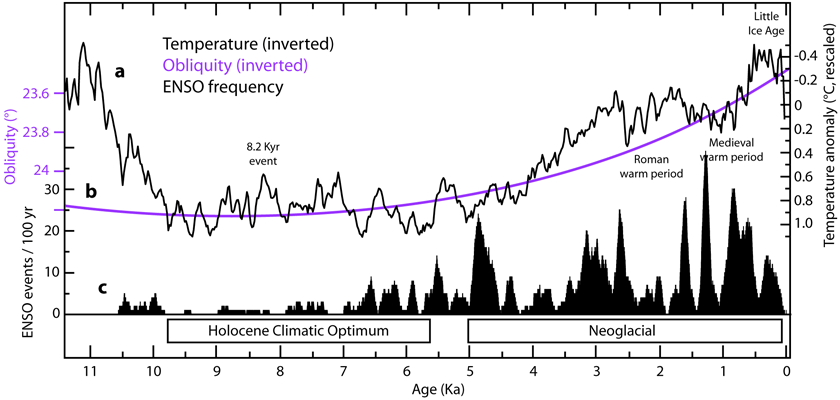
El Niño Southern Oscillation (ENSO) is the main source of interannual tropical climate variability with an important effect on global temperature and precipitation. Paleoclimatic evidence supports a relationship between ENSO and solar forcing. Moy et al. (2002) attribute the long-term increasing trend in ENSO frequency to orbitally induced changes in insolation (figure 1). The ENSO proxy record described by Moy et al. (2002) displays a millennial-scale oscillation that in the middle Holocene shifts its variance from a 1000-1500-yr period to a 2000-2500-yr period (Moy et al. 2002, their figure 1c). Both frequencies correspond to known solar periodicities, the Eddy and Bray solar cycles. As it has been shown previously (see “Centennial to millennial solar cycles“) the 1000-yr Eddy solar cycle became weaker at the Mid-Holocene Transition regaining strength in the last 2000 years. This 14C-deduced solar behavior corresponds to the ENSO behavior described by Moy et al. (2002).
Figure 1. a) Inverted global average temperature anomaly reconstruction (black line, right scale) from the 73 proxies used by Marcott et al. 2013. The temperature scale has been rescaled to produce a difference of 1.2 °C between the Holocene Climatic Optimum (HCO) and the Little Ice Age, supported on a consilience of glaciological, biological and marine sedimentary evidence that supports a 1-1.5 °C difference. b) Inverted obliquity (purple line, left scale). c) ENSO frequency (black, left scale) measure as the number of strong El Niño events in a 100-yr sliding window, from Moy et al. 2002. ENSO activity was very low during the HCO and has been increasing as the planet cooled during the Neoglacial, following changes in insolation caused by orbital changes in precession and obliquity.
In 2000 Theodore Landscheidt published an article in the proceedings from a meeting presenting his hypothesis of a solar forcing of El Niño and La Niña. He was not the first to defend such hypothesis, as 10 years earlier Roger Anderson (1990) had published some evidence for a solar cycle modulation of ENSO as a possible source of climatic change. Landscheidt’s (2000) article contains two observations and two predictions. The first observation is that most extreme ENSO events correlate with the ascending or descending phase of the solar cycle. He predicted the following El Niño based on the sun’s orbital angular momentum for 2002.9 (± 0.4). It was a 2-year ahead accurate prediction, as the next El Niño started in 2002.67. The second observation was the alternating preponderance of El Niño and La Niña following the 22-year Hale magnetic solar cycle. The 1954-76 Hale cycle showed Niña preponderance, and was followed by the 1976-96 that presented Niño dominance. While this is based only on two complete Hale cycles for which there is instrumental ENSO data it is interesting to read Landscheidt other prediction:
“If the pattern holds a preponderance of La Niña is to be expected during the Hale cycle that began in 1996.”
The Hale cycle-ENSO association is unclear to me due to insufficient data but it is undeniable that both of Landscheidt predictions were correct. Anderson’s and Landscheidt’s articles were completely ignored by the scientific community and they are rarely cited even by authors studying the same subject.
In 2008 van Loon & Meehl showed that the Pacific Ocean displayed a response to peak solar activity years similar to La Niña event years in the Southern Oscillation, but with a different stratospheric response. Haam & Tung (2012), however, failed to find an association between solar peak and La Niña years and warned that two autocorrelated time series might present a spurious correlation by chance. As I will show the problem is in the assumption that ENSO must display a linear response to solar activity with ENSO extremes at maximal and minimal solar activity. This assumption turns out to be false and the analysis of Haam & Tung (2012) using peak-solar years is misleading.
ENSO is usually described as a 2-7-year oscillation, while the Schwabe solar cycle is an 11 ± 2-year oscillation, so no linear relationship is obvious. White & Liu (2008) defend that most El Niño and La Niña episodes from 1900–2005 are grouped into non-commuting pairs that repeat every ~ 11 years, aligned with rising and falling transition phases of the solar cycle as Landscheidt (2000) described (they don’t cite him). These alignments arise from non-linear phase locking between an 11-year solar forced first harmonic and the 3rd and 5th 3.6 and 2.2-year harmonics in ENSO. These solar-forced 3rd and 5th harmonics explain ~ 52% of inter-annual variance in the Nino-3 temperature index. White & Liu (2008) propose “a new paradigm for ENSO, with El Niño and La Niña driven by the solar-forced quasi-decadal oscillation via non-linear processes in the tropical Pacific delayed action/recharge oscillator.”
Despite the evidence for a solar forcing of ENSO the accepted paradigm from model studies is that ENSO is self-excited or driven by internal variability random noise.
More recently two solar physicists, Leamon & McIntosh (2017), reported on the coincidence of the termination of the solar magnetic activity bands at the solar equator every ~ 11 years since the 1960s with a shift from El Niño to La Niña conditions in the Pacific. Their report prompted me to examine the issue, observing a pattern repetition since 1956 (figure 2). The solar minimum is preceded by Niña conditions, followed by Niño conditions, and afterwards Niña conditions accompany the rapid increase in solar activity.
Figure 2. Top: Six-month smoothed monthly sunspot number from SILSO. Bottom: Oceanic El Niño Index from NOAA. Red and blue boxes mark the El Niño and La Niña periods in the repeating pattern. This figure was published in July 2018 in an article at WUWT. Since then the Niño prediction has been confirmed.
If we assign 50% probability for seasonal positive or negative ONI (Oceanic Niño Index) values, the probability that the solar minimum will be preceded by Niña conditions, and followed by Niño conditions for six consecutive solar minima by chance is of only 0.024% (1 in 4000). The probability of the entire pattern (Niña-Niño-Niña) repeating six times at a specific time is even lower, indicating that the association between solar activity and ENSO is not due to chance. Solar control of ENSO has led to the prediction of El Niño conditions in 2018-19 by me, and to La Niña conditions in 2020-21 by Leamon & McIntosh (2017). The 2018-19 Niño prediction has been correct.
To perform a no-assumptions analysis of solar activity-ENSO correlation it is necessary to correct for the irregularities in the solar cycle, that can last from less than 9 years to more than 13. Since the sunspot dataset is very noisy I have chosen the 13-month smoothed monthly total sunspot number from SILSO.
The smoothed monthly number results from an averaging of monthly mean values over 13 months, from 6 months before to 6 months after a base month. All months are weighted equal except for the extreme ones, which are weighted by 1/2. This smoothing has been used since the early 20th century to define the times of maximum and minimum for each cycle.
Since solar minima have different levels of activity and different length, the starting and ending months for each solar cycle are defined for the purpose of this study not from the solar minimum, but from the first month that presents >30 smoothed monthly sunspots. This point in the cycle, at the beginning of the rapid ascending phase is more unambiguously defined to a single month that the solar minimum allowing for more confidence in a proper alignment of the solar cycles.
Defined in this way the last six complete solar cycles (SC18-23) have durations between 121 and 159 months. To correct for this variable length each solar cycle is divided into 22 bins that for a regular 11-year solar cycle would contain 6 months, but depending on the cycle length they can have from 5 to 8 months. After the procedure the variable solar cycle length has been normalized into a solar cycle unit (Figure 3).
Figure 3. Thin lines, solar cycles 18-24 with their respective durations normalized in terms of a full cycle and divided in 22 bins. The average monthly smoothed sunspot number for each bin is represented as a point. Thick line, average solar activity for the normalized solar cycles. Grey area standard deviation.
The analysis is restricted to the period 1950-2018, when ONI data and the smoothed monthly sunspot number were available.
ONI values are also grouped into bins corresponding to the solar activity bins. For each 1/22 fraction of the solar cycle we have six 5-8 month sunspot bins from the six solar cycles considered, and the corresponding six 5-8 month ONI bins for the same dates. The values in each bin are averaged and the mean and standard deviation for the six bins corresponding to the same solar cycle fraction obtained. The ONI dataset has a near-normal distribution with a mean very close to zero (figure 4).
Figure 4. Distribution of the 816 twelve-month periods in the 1950-2018 ONI database according to their average ONI value. The distribution follows a near-normal distribution with a mean of 0.025.
The numerical treatment of ONI values is not expected to produce values significantly different from zero if solar activity has no significant effect on ENSO. Also ONI values are expected to deviate randomly from zero at each solar cycle fraction without presenting an 11-year pattern if solar activity has no effect on ENSO. By contrast what we find is clear departures from zero, whose statistical significance will be analyzed later, and an 11-year pattern. The 22 ONI averaged values organize in two periods of more probable El Niño and two periods of more probable La Niña (figure 5). This is likely a reflection of the non-commuting El Niño and La Niña pairs that repeat every ~ 11 years found by White & Liu (2008).
Figure 5. a) Average (black line) and standard deviation (grey area) solar activity in monthly smoothed sunspot number (left scale) for the solar cycles between 1950-2018 divided in 22 fractions of a solar cycle. b) Average (dark red and blue areas) and standard deviation (pink and light blue areas) ONI values (right scale) for the same periods. The plot has been divided in five phases (dashed vertical lines) labeled in roman numbers (see text).
Attending to ONI zero-line crossing and variability I have divided the solar cycle into five ENSO phases. Phase I starts when the peak in solar activity is reached (c. 2.5 years into the cycle as defined on average), and lasts around two and a half years during which El Niño conditions are more probable, following the peak in solar activity. Phase II, of another two and a half years length, coincides with declining solar activity. This is a highly variable period when strong La Niña conditions might take place, but during most cycles it has presented strong El Niño conditions. This might be related to the string of very active solar cycles that between 1935 and 2004 have constituted the Modern Solar Maximum, and might represent a delayed response to above average insolation. This phase corresponds to Landscheidt’s observation of strong events during the declining phase of the solar cycle that would correspond preferentially to Niña or Niño depending on the Hale cycle. Phase III, of around three years, coincides with the final decline in solar activity towards the solar minimum, and usually presents La Niña conditions. Particularly frequent is a La Niña right before the solar minimum (figure 2). Phases I to III correlate in general terms with solar activity and might represent a response to solar irradiance. The last two phases display anti-correlation to solar activity. Phase IV, a short period of about 1.5 years, starts around the time of minimal solar activity, but it results in El Niño conditions that can be considerably strong at times, like in 1998. Afterwards, phase V coincides with the period of rapidly rising solar activity, that very reproducibly presents La Niña conditions. Phase IV and V do not appear to follow changes in TSI, so the suggestion by Leamon & McIntosh (2017) that they could depend on other solar parameters or galactic cosmic rays appears reasonable. Certain solar wind properties change trend at the solar minimum, like its electric field strength, or the Alfvén Mach number that reflects plasma wave speed, that peaks at the minimum. Solar wind effects on the magnetosphere have been known for long, and solar-wind-induced changes in the global electric circuit affect weather parameters at the troposphere (Lam & Tinsley 2016).
Now we can see why Haam & Tung (2012) could not find a correlation between solar peak years and La Niña, as this condition takes place preferentially during the 1.5-2 years prior to the solar peak.
To analyze how statistically significant is the solar effect on ENSO I chose Phase V that presents the biggest ONI departure from zero and even its standard deviation range does not include the zero value. A specific procedure was followed for the statistical test. The smoothed monthly sunspot number was set to zero at the solar minimum and 100 at the solar maximum for each cycle. The months when the sunspot number increased from 35% to 80% of the maximum for each cycle were selected as they define the rapid ascent in solar activity that on average lasts one year. The 76 ONI values corresponding to those months from six solar cycles (SC19-24) have an average ONI value of -0.65. Consider this: six periods of ~ 1 year selected on a solar activity criterion display an average full fledged Niña condition. What are the chances of that? To find out I made a dataset with all the 12 consecutive months averages in the ONI database (816 instances, figure 4) and then randomly picked six of them and averaged them. I did that 100,000 times in a Monte Carlo analysis and only in 0.7% of the tests I obtained an equal or lower ONI average. The La Niña -0.65 ONI value at 35 to 80% solar activity has a 99.3% probability of not being due to chance. ENSO is under solar control.
Of course ENSO is not exclusively under solar control as it is a very complex phenomenon, and thus we shouldn’t expect that the patterns are always reproduced. However it is clear from paleoclimatic data (Moy et al., 2002), solar physics (Leamon & McIntosh 2017), Modeling and reanalysis (van Loon & Meehl 2008), frequency analysis (White & Liu 2008), and the present analysis, that solar activity has a clear strong effect on ENSO, probably being its main forcing. The reported 2-7-year ENSO periodicity appears to be an 11-year periodicity with several occurrences. The present (mid-2019) position in the solar cycle is at the transition between phases III-IV, close to the solar minimum. With some uncertainty due to the irregularity of the 11-yr solar cycle, a La Niña can be projected for phase V, by mid-2020 (Leamon & McIntosh 2017). The failed El Niño projection from February 2017 by ENSO models (figure 6) took place at the transition between phases II and III in figure 5, a time when the solar cycle favors La Niña conditions that finally developed a few months later. This is an instance when ENSO prediction from solar activity would have been superior to models.
Figure 6. ECMWF ENSO forecast for February 2017 indicating Niño conditions for late summer at a time solar activity favored Niña conditions due to the transition from phase II to III. Finally Niña conditions developed.
The solar effect on ENSO could be responsible for the detected global temperature variation of 0.1-0.2 °C between solar cycle maximum and minimum (Tung and Camp, 2008), attributed to tropical evaporative feedback (Zhou and Tung, 2013). ENSO is the leading mode of interannual variability in the tropical climate system, with a global impact on surface temperature and precipitation. Its frequency has been implicated in interdecadal shifts in the tropical Pacific climate (Kumar and Hu 2013). The latest shift in 2000 has been related to the subsequent reduced rate of warming observed during the pause, a period characterized by a higher frequency of La Niña, until the 2015 El Niño put an apparent end to it. Given the clear association between solar activity and ENSO, an interesting question is if long-term changes in solar activity could be responsible for long-term changes in ENSO frequency. To compare them, 10.7 cm solar flux data, and ONI data were smoothed with a Gaussian filter equivalent to an 11-year moving average (figure 7).
Figure 7. Gaussian smoothed 1950-2018 Oceanic Niño Index (black line delimiting red and blue areas, right scale), and Gaussian smoothed 1950-2018 10.7 cm solar flux, a proxy for solar activity (thick dashed line, left scale). A 4-year lagged 10.7 cm solar flux (thick continuous line) shows that periods of high solar activity tend to coincide with periods of predominant Niño conditions, and periods of low solar activity tend to coincide with periods of predominant Niña conditions.
Long-term changes in ENSO frequency are compatible with long-term changes in solar activity. Peaks and troughs in ENSO frequency follow with a ~ 4-year lag peaks and troughs in long-term solar activity. Since ENSO activity is clearly directed by solar activity (figure 2), it is likely that the long-term correlation between both has a physical basis. If the effect of long-term changes in solar activity has to account for this lagged long-term effect on ENSO, its effect on global temperature must be much higher that the effect detected over a single solar cycle. By altering ENSO frequencies, solar activity might alter the decadal rates of warming, leading to periods of increased warming and periods of reduced warming (pauses). The 2015 El Niño has put an apparent end to the La Niña-predominant period since 2000, and to the period of reduced warming. However, if the relation between solar activity and ENSO frequency is maintained, we can project that both should continue until long-term solar activity increases again in the future.
How can we use solar activity to improve our ENSO predictions?
Figure 5 shows a probabilistic plot of ENSO in terms of solar activity. By knowing or estimating where in the solar cycle we are we can get an estimate of the chances of a particular outcome even years ahead. This can then be compared to models output when they become available. If they disagree like it happened in February 2017 we should reduce our confidence on the model prediction, and increase it when there is agreement. Landscheidt method also deserves closer attention to examine how well it has performed since 2000. Leamon & McIntosh (2017) have predicted a Niña for 2020, and over a year ago I predicted the 2018-19 Niño based on solar activity at an article at WUWT.
It is clear that even in a crude form solar activity is useful for ENSO prediction and no doubt the method can be improved enormously as Landscheidt suggested: “these problems can only be solved by a joint interdisciplinary effort of open-minded scientists.”
Data sources and bibliography [ link]