by Judith Curry
An assessment of whether any of the impacts of recent U.S. landfalling hurricanes were exacerbated by global warming.
6. Attribution: Recent U.S. landfalling hurricanes
During the past decade, the following continental U.S. landfalling hurricanes rank in the top 5 historical hurricanes in terms of damage:
- Hurricane Harvey (2017)
- Hurricane Sandy (2012)
- Hurricane Irma (2017)
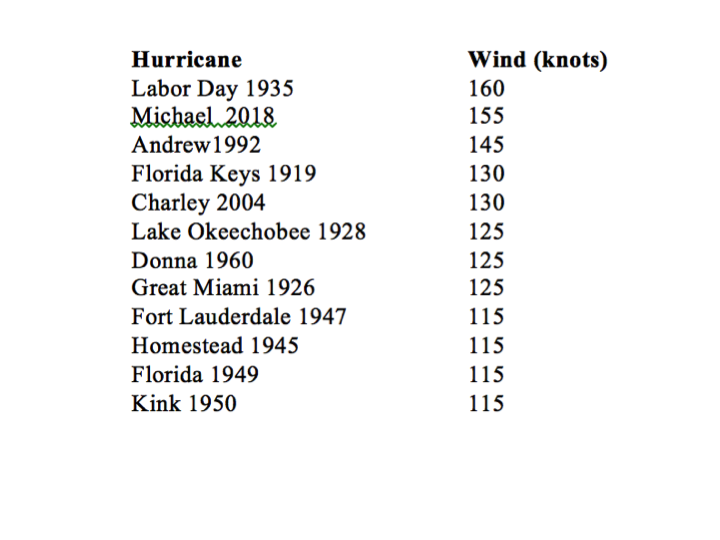
Hurricane Michael ranks in the top 5 strongest continental U.S. landfalling hurricanes (Table 6.1).
Table 6.1 Strongest U.S. landfalling hurricanes. Source:Scientists have argued (in journal publications and media interviews) that at least some aspect of each of these storms was made worse by human-caused global warming: track, intensity, size, rainfall. Here we assess the arguments for claiming a contribution from global warming for each of these four impactful storms.
6.1 Detection and attribution of extreme weather events
Given the challenges to actually detecting a change in extreme weather events owing to the large impact of natural variability, the detection step is often skipped and attribution arguments are made, independent of detection. There are two general types of extreme event attribution methods that do not rely on detection: physical reasoning and fraction of attributable risk (NCA4, 2017),
The fraction of attributable risk approach examines whether the odds of occurrence of a type of extreme event have changed. A conditional approach employs a climate model to estimate the probability of occurrence of a weather or climate event within two climate states: one state with anthropogenic influence and the other state without anthropogenic influence (pre-industrial conditions). The “Fraction of Attributable Risk” framework examines whether the odds of some threshold event occurring have been increased due to manmade climate change.
Participants at the 2012 Workshop on Attribution of Climate-related Events at Oxford University questioned whether extreme event attribution was possible at all, given the inadequacies of the current generation of climate models (Nature, 2012):
“One critic argued that, given the insufficient observational data and the coarse and mathematically far-from-perfect climate models used to generate attribution claims, they are unjustifiably speculative, basically unverifiable and better not made at all.”
Given the inadequacies of climate models particularly for simulating tropical cyclones, attribution arguments related to individual hurricanes typically rely on the physical reasoning approach. The physical reasoning approach, often referred to as the conditional or ingredients-based approach, looks for changes in occurrence of atmospheric circulation and weather patterns relevant to the extreme event, or considers the impact of certain environmental changes (for example, greater atmospheric moisture) on the character of an extreme event.
6.2 Hurricane Sandy
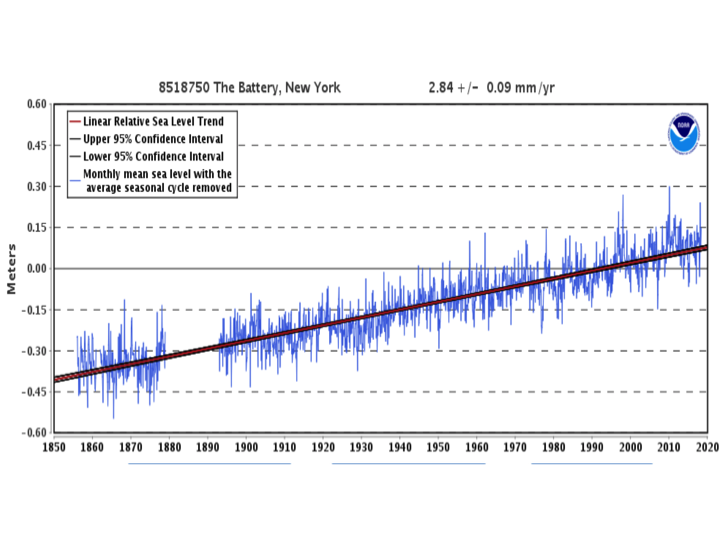
Hurricane Sandy made landfall on 10/22/12 near Atlantic City, NJ. Hurricane Sandy’s most substantial impact was a storm surge. The highest measured storm surge from Sandy was 9.4 feet (at The Battery)[2]. The argument is that human-caused global warming worsened the storm surge because of sea level rise.
Curry (2018a) summarized sea level rise at The Battery. Sea level has risen 11 inches over the past century (Figure 6.1), with almost half of this sea level rise caused by subsidence (sinking of the land). Kemp et al. (2017) found that relative sea level in New York City rose by ~1.70 meters [5.5 feet] since ~575 A.D. A recent acceleration in sea level rise between 2000 and 2014 has been attributed to an increase in the Atlantic Multidecadal Oscillation and southward migration of the Gulf Stream North Wall Index. The extent to which manmade warming is accelerating sea level rise remains disputed (as summarized by Curry, 2018a).
When Hurricane Sandy made landfall on the mid-Atlantic coast, it was no longer classified as a tropical cyclone, but its maximum wind speed at landfall was equivalent to a Category 1 hurricane. As a result of its transition from a tropical cyclone, Sandy became a hybrid storm, which greatly increased its horizontal size.
Figure 6.1. Tide gauge measurements at The Battery, New York, obtained from NOAA (downloaded 8/2/18)..
The 2017 U.S. Climate Change Special Report (NCA4, 2017) evaluated published analyses seeking to attribute aspects related to Hurricane Sandy to human-caused global warming: e.g. sea surface temperatures, atmospheric temperatures, atmospheric moisture, and hurricane size. The analysis concluded:
“In summary, while there is agreement that sea level rise alone has caused greater storm surge risk in the New York City area, there is low confidence on whether a number of other important determinants of storm surge climate risk, such as the frequency, size, or intensity of Sandy-like storms in the New York region, have increased or decreased due to anthropogenic warming to date.”
6.3 Hurricane Harvey
Hurricane Harvey made landfall in southern Texas on August 24, 2017 as a Category 4 hurricane. The primary damage from Harvey occurred after the storm had been downgraded to a tropical storm and stalled near the coastline, dropping torrential and unprecedented amounts of rainfall over Texas.
As summarized by Landsea (2017), observations indicate a maximum amount of rainfall of about 60 inches just east of Houston, with much of southeastern Texas receiving at least two feet of rainfall. Harvey set the record for most amount of rainfall from a continental U.S. hurricane, going back at least to the 1880’s when comprehensive records begin. The previous top four rainfall producers were: Tropical Storm Amelia (1978) with 48 inches in Texas, Hurricane Easy (1950) with 45 inches in Florida, Tropical Storm Claudette (1979) with 45 inches in Florida, and Tropical Storm Allison (2001) with 40 inches in Texas. Harvey’s stalled, meandering track was similar to Tropical Storms Claudette and Allison. But the peak amount of rainfall from Harvey, as well as Harvey’s areal extent of extreme rainfall, substantially surpassed either of these earlier storms.
Several publications based on model simulations have concluded that as much as 40% of the rainfall from hurricane Harvey was caused by human-caused global warming (Emanuel 2017; Risser and Wehner 2017).
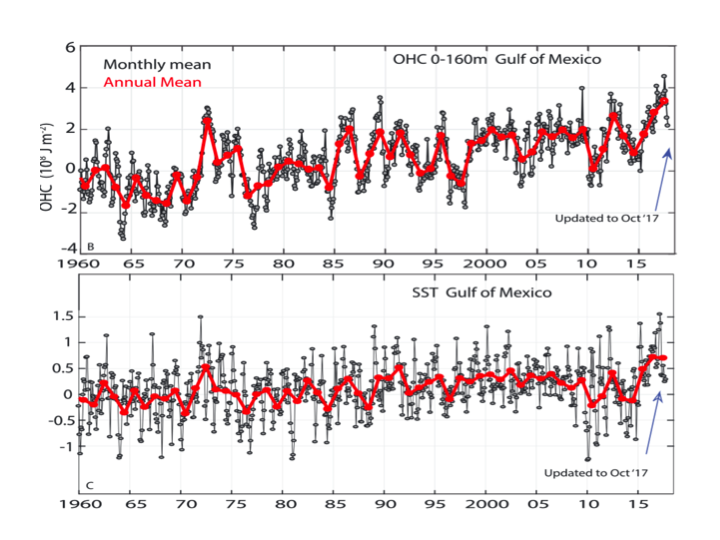
The rationale for these assessments was that prior to the beginning of northern summer of 2017, sea surface temperatures in the western Gulf of Mexico exceeded 30 oC [86 oF] and ocean heat content was the highest on record in the Gulf of Mexico (Trenberth et al. 2017). However, El Niño–Southern Oscillation (ENSO) and Atlantic circulation patterns contributed to this heat content, and hence it is very difficult to separate out any contribution from human-caused global warming.
Figure 6.2 shows that the Gulf of Mexico has warmed by about 0.7 F (0.4 C) in the last few decades (Trenberth et al. 2018).
Figure 6.2. Ocean heat content anomalies (top) for the monthly (black) and annual (red) for the upper160 m in the Gulf of Mexico and sea surface temperature anomalies (bottom) in the Gulf of Mexico (degrees C). The baseline is 1961–1990. Source: Trenberth et al. (2018)
Landsea (2017) summarizes the arguments for more rainfall from tropical cyclones traveling over a warmer ocean. Intuitively, rainfall from hurricanes might be expected to increase with a warmer ocean, as a warmer atmosphere can hold more moisture. Simple thermodynamic calculations suggest that the amount of rainfall in the tropical latitudes would go up about 4% per oF [7% per oC] sea surface temperature increase. Examining a 300 mile radius circle for nearly all of the rain implies that about 10% more total hurricane rainfall for a warming of 2-2.5 F [1-1.5 C]. The Gulf of Mexico has warmed about 0.7 oF [0.4 oC] in the last few decades. Assuming that all of this warming is due to manmade global warming suggests that roughly 3% of hurricane rainfall today can be reasonably attributed to manmade global warming. Hence, only about 2 inches of Hurricane Harvey’s peak amount of 60 inches can be linked to manmade global warming.
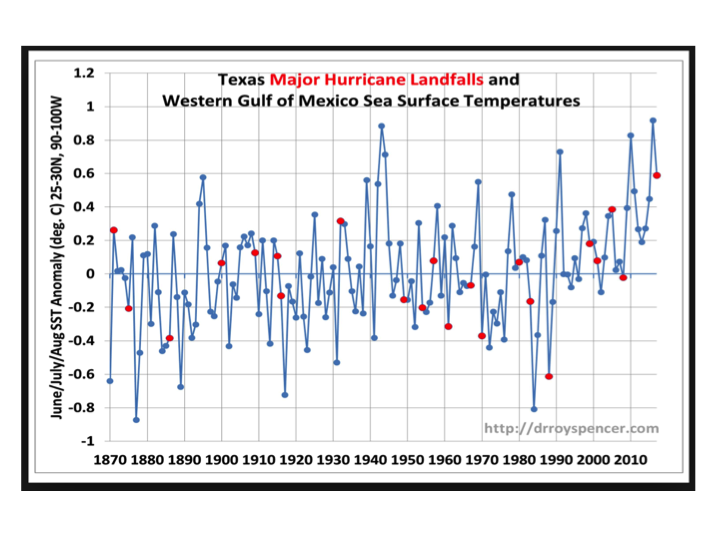
Figure 6.3 illustrates the role of sea surface temperature in the western Gulf on Texas major hurricane landfalls. Ten major hurricane Texas landfalls were observed to occur with anomalously cool Gulf sea surface temperatures, while 11 occurred with anomalously warm Gulf sea surface temperatures.
Figure 6.3. Texas major hurricane landfalls and Western Gulf of Mexico sea surface temperatures. Source: Roy Spencer
6.4 Hurricane Irma
Hurricane Irma made landfall on September 10, 2017 as a Category 4 hurricane. Hurricane Irma set several records. Irma was the 5th strongest Atlantic hurricane on record. Irma was the 2nd strongest Atlantic storm in recorded history in terms of its accumulated cyclone energy – a function both of intensity (wind speed) and duration of the storm. Irma is tied with the 1932 Cuba Hurricane for the longest time spent as a Category 5 hurricane. Hurricane Irma maintained 185-mph winds for 37 hours — longer than any storm on record globally.[3]
Irma formed and rapidly intensified to a major hurricane in the eastern Atlantic, where sea surface temperatures were 26.5 oC (80 oF). The rule of thumb for a major hurricane is 28.5 oC. Clearly, simple thermodynamics associated with SST were not driving this intensification, but rather favorable atmospheric dynamics. In particular, wind shear was very weak. Further, the atmospheric circulation field (e.g. stretching deformation) was very favorable for spinning up this hurricane (Curry, 2017).
While the media made much ado about a global warming link to Irma’s intensity, there have been no published journal articles to date that have examined this issue. This is presumably because the sea surface temperatures during Irma’s development and intensification were relatively cool.
Since 1900, 14 Category 4 or 5 hurricanes have struck Florida (Table 6.2).
Table 6.2 Category 4 and 5 hurricanes that have struck Florida. Source: NOAA
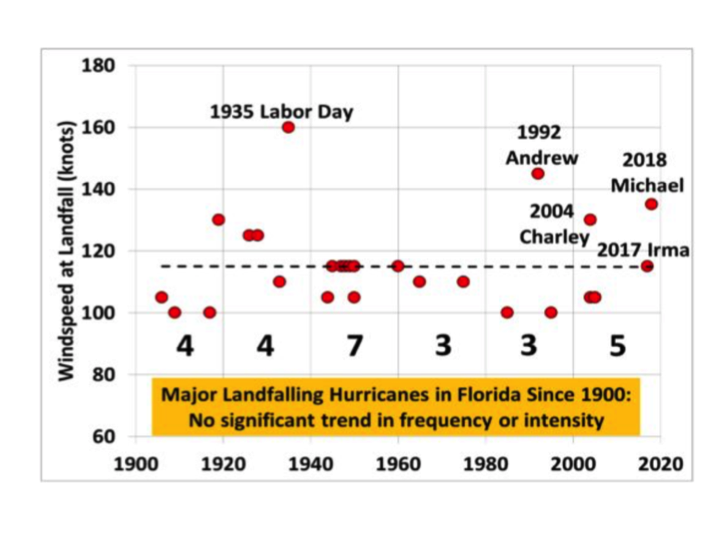
Figure 6.4 analyzes the time series major (Cat 3+) landfalling hurricanes in Florida since 1900. There is no significant trend in either frequency or intensity.
Figure 6.4 Florida major hurricane landfalls. Source: Roy Spencer
6.5 Hurricane Michael
Hurricane Michael made landfall on the Florida Panhandle on October 10, 2018 as a strong Category 4 hurricane. Michael was one of the strongest hurricanes in recorded Atlantic history, and ranks #4 in terms of landfall winds (Table 6.1). The National Hurricane Center estimated peak storm surge inundation of 9-14 feet on the Florida Panhandle (Table 5.2).
During late summer, sea surface temperatures typically exceed 80 oF, which is more than sufficiently warm to sustain a major hurricane. The water in Michael’s path was 2 to 4 oF warmer than usual. Since 1985, sea surface temperatures in the Eastern Gulf of Mexico have increased by about 1 oF (Kennedy et al. 2007).
The most striking aspect of Hurricane Michael was its rapid intensification, from a Category 1 to Category 4 in 24 hours, as it traveled over a very warm patch of water off the coast of Florida. Near Florida, there are deep warm pools of water that move around (the Gulf Loop Current). If a hurricane travels over one of these deep warm pools, it will rapidly intensify if the atmospheric circulation patterns are favorable. Hurricanes Katrina and Rita in 2005 are examples of similar intensification.
For a tropical storm or hurricane to rapidly intensify, it needs three key ingredients: low wind shear, warm ocean water and high humidity. All of these ingredients were in place for Michael, which is somewhat unusual for October. Rather than the typical cold fronts bringing higher wind shear and dry air, circulation patterns were relatively stagnant, providing favorable conditions for Michael to intensify.
Figure 6.5 Sea surface temperature anomalies during Hurricane Michael. Source: Phil Klotzbach
A Category 4 hurricane striking the Gulf coast of Florida is nothing new (Table 6.2). The most notable of these storms in context of a manmade global warming argument is the 1848 Great Gale hurricane that struck Tampa Bay,[4] with a measured barometric pressure and storm surge that are consistent with a Category 4 hurricane. Global temperatures (and presumably the sea surface temperatures in the Gulf of Mexico) were substantially cooler in the mid 19th century.
6.6 Conclusions
Convincing detection and attribution of individual extreme weather events such as hurricanes requires:
- a very long time series of high-quality observations of the extreme event
- an understanding of the variability of extreme weather events associated with multi-decadal ocean oscillations, which requires at least a century of observations
- climate models that accurately simulate both natural internal variability on timescales of years to centuries and the extreme weather events
Of the four hurricanes considered here, only the rainfall in Hurricane Harvey passes the detection test, given that it is an event unprecedented in the historical record for a continental U.S. landfalling hurricane. Arguments attributing the high levels of rainfall to near record ocean heat content in the western Gulf of Mexico are physically plausible. The extent to which the high value of ocean heat content in the western Gulf of Mexico can be attributed to manmade global warming is debated. Owing to the large interannual and decadal variability in the Gulf of Mexico (e.g. ENSO), it is not clear that a dominant contribution from manmade warming can be identified against the background internal climate variability (Chapter 4).
JC note: next (and final) post in this series is 21st century projections.