by Alan Cannell
The new tropical lands: a carbon sink during formation and huge source of carbon dioxide and methane when lost to the sea.
- Why do Sea Level Changes Always Stop at about the Same Heights?
Sea water levels in the Red Sea (Hannish Sill) shows that these have risen and fallen between two extremes many times over the past 500ky (1). Slow cooling leads to a glacial minimum at about -120m below the present level, rapid warming to a new equilibrium at around current values. The question is not so much why these cycles occur, but why do they stop at these depths?
The answer seems to lie in the geography of the shallow seas and continental shelves that lie between latitudes +30 and -30. This is the zone of the trade winds where most water vapor evaporation takes place and is also the zone where, with the rise and fall of the seas, large tracts of land emerge and then sink again below the waves.
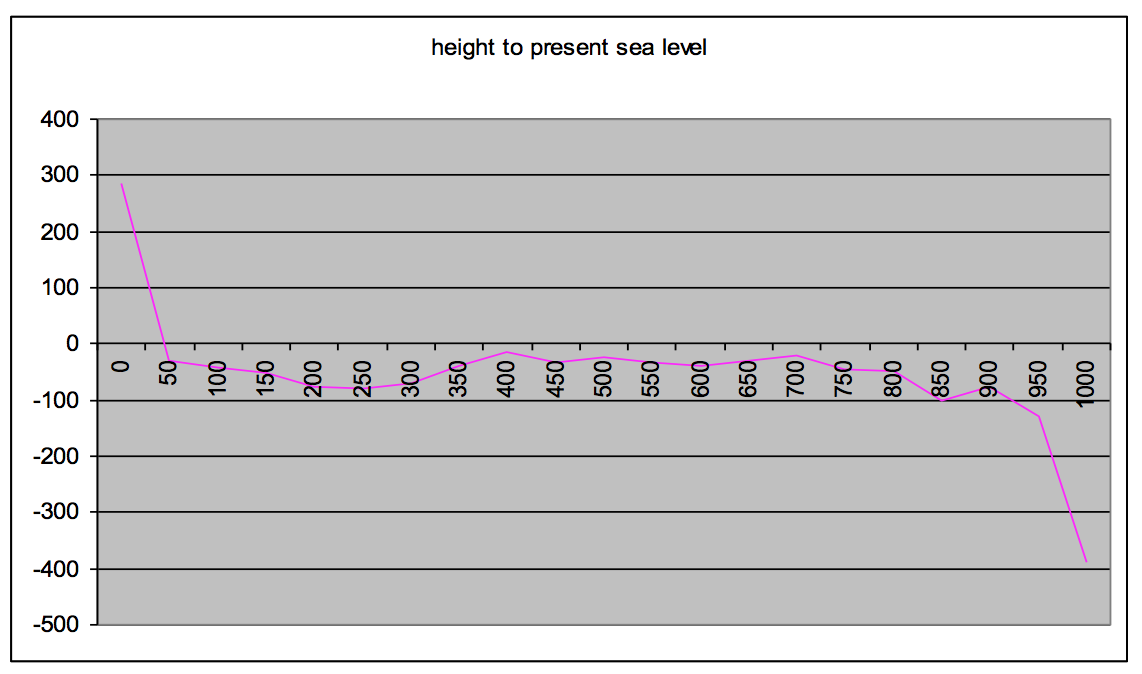
The largest of these areas is Sunda, the land exposed during glacial periods between S.E. Asia and Australia. A 1000 km cross section from the hills on the east Thai coast directly east to the Spartly islands shows that most of this area lies at less than 100 m below current sea level: at the coast, the land rises steeply, beyond the continental shelf, at about -120m, the sea floor drops off sharply.
This is fairly typical for most of the Sunda area so figure 2 can also be taken to roughly represent height (h) to Surface Area (SA).
Fig. 1 Cross Section E-W of the Sunda Plateau (latitude 8 degrees N) in km against Height above Present Sea level
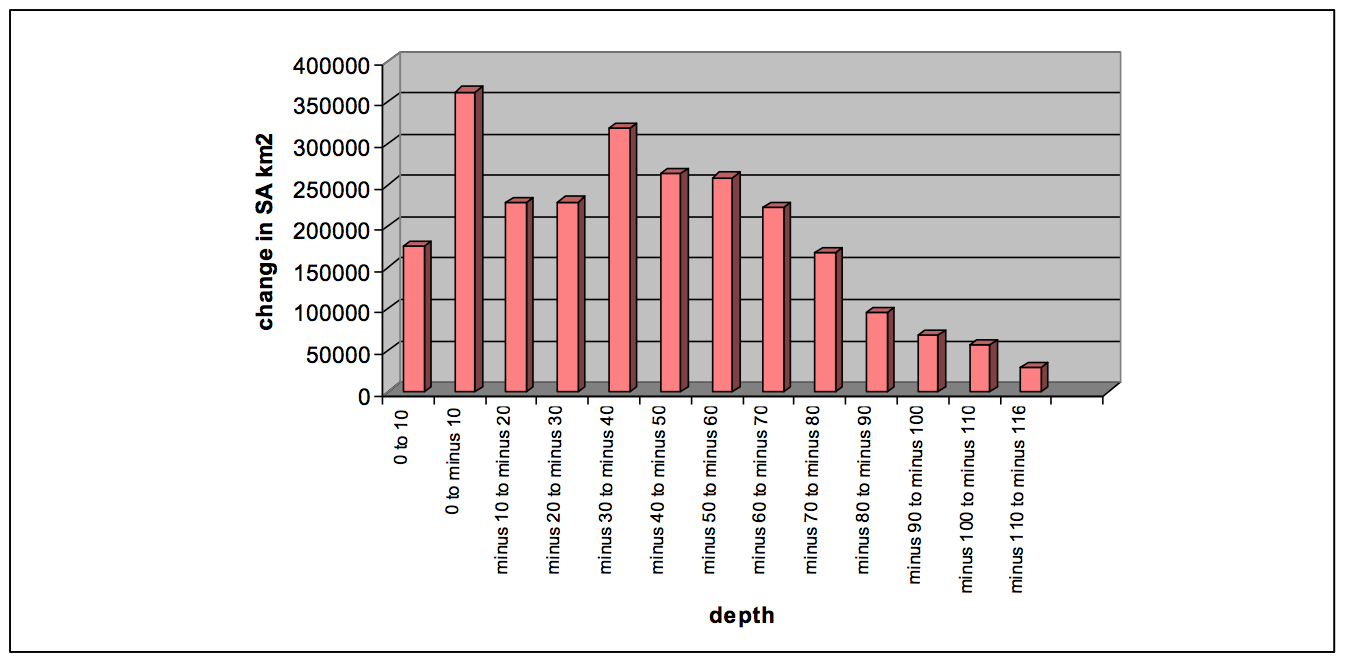
In other words, the rate of change in sea Surface Area (dSA) per change in height (dh) goes from close to zero, to a maximum then back to around zero. Sathiamurthy and Voris (2) have estimated this rate for 10m intervals for the entire Sunda zone and, as shown below in Figure 2, the change in SA in km2 per change in 10m (dSA/dh) goes from some 160,000 km2 in new sea area as the level rises from zero to +10 m, to a maximum of 250-350,000 km2 between -10 and -60 m and then falls back to 30,000 km2 at -110 m to -116 m.
Fig. 2 Change in Land Surface Area per Change in Sea level
Water vapor is the most potent greenhouse gas and changes in sea level form a feedback process: when warming is taking place the ice caps melt and new areas of warm tropical seas are added that will increase water vapor in the air through evaporation; when cooling is taking place there is transfer of vapor (as snow) to the ice sheets, which stops when no significant new dry land is gained by a further drop in sea level along the continental shelves. If we assume evaporation (E) in the tropics to be proportional to SA, then dE/dh follows the same pattern. Equilibrium sea levels are reached when:
dE/dh→0
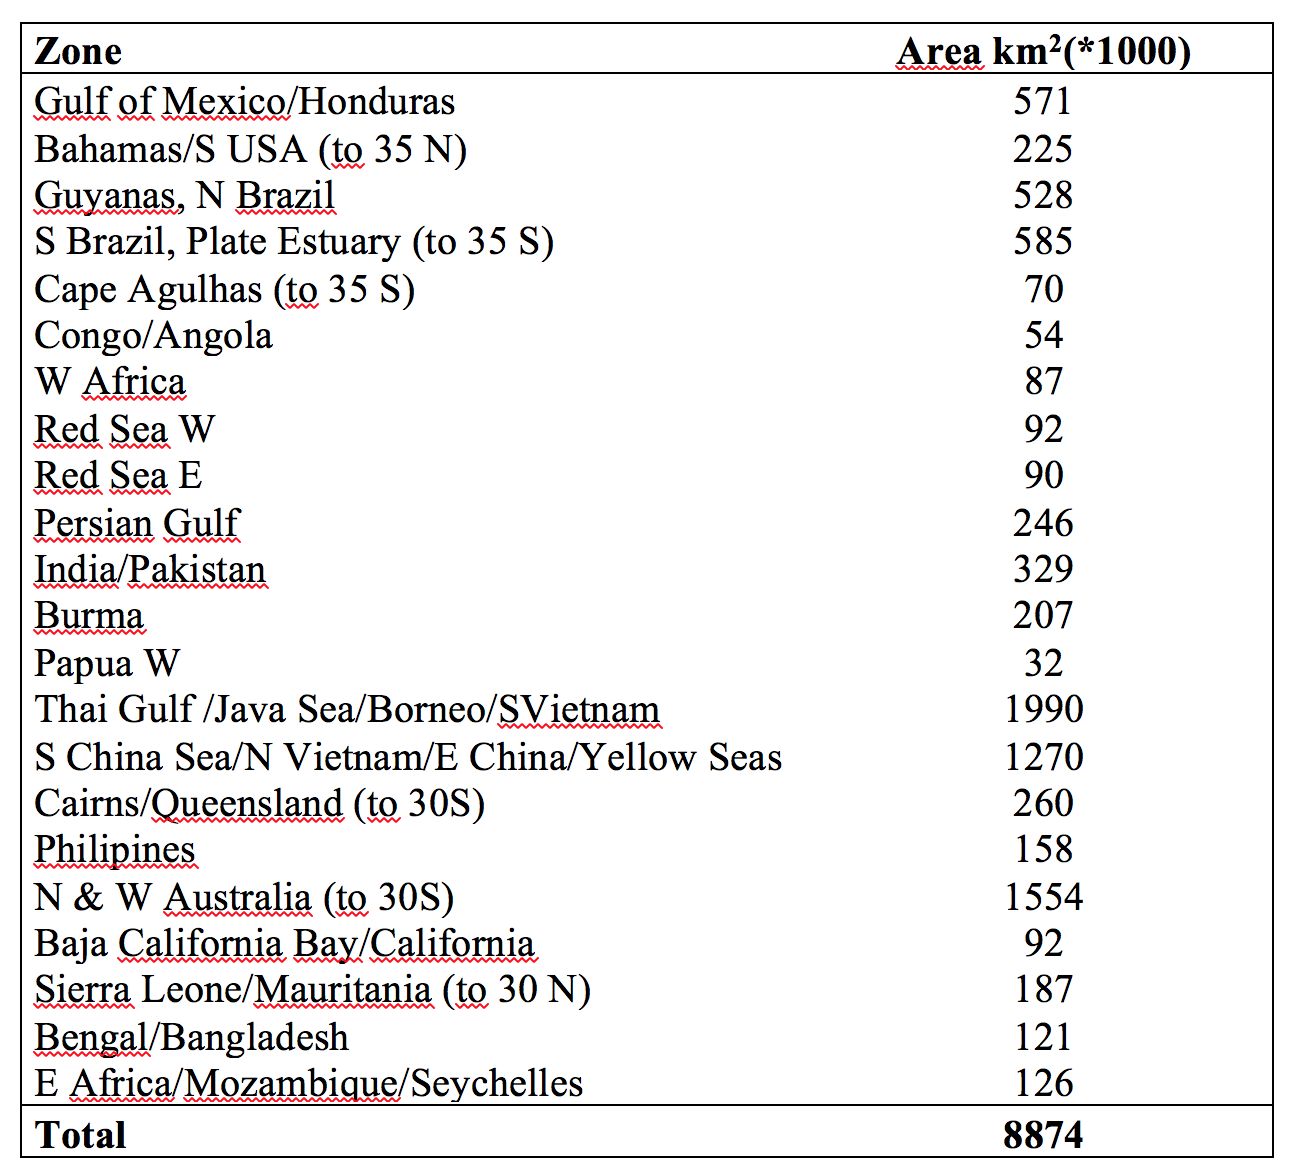
With Google Earth it is possible to estimate the major areas within the tropics/sub-tropics affected by glacial sea level changes, using the -120 m contour as a guide, as shown in Table 1.
When islands are taken into consideration, the total tropical/sub-tropical land area exposed during a glacial minimum sea level can be taken as around 9 million km2. Virtually all of these major coastal shelves follow a similar pattern of rapid drop-off around -120m and a sharply elevating coastline at the present sea level, so a painstaking analysis of all land between of 0-10 m would reveal a similar pattern to that shown in Figure 2 for Sunda. Thus the highly complex interrelation of ice, sea and land follows a very simple equation: when dSA/dh is at a minimum the feedback process stops and this is reached when sea level is at the present or at -120 m ( 120 m below present sea-level).
Table 1. Tropical and Sub-Tropical Lands Revealed by Sea Level at -120 m
- Atmospheric Pressure and Temperature in Glacial Eras
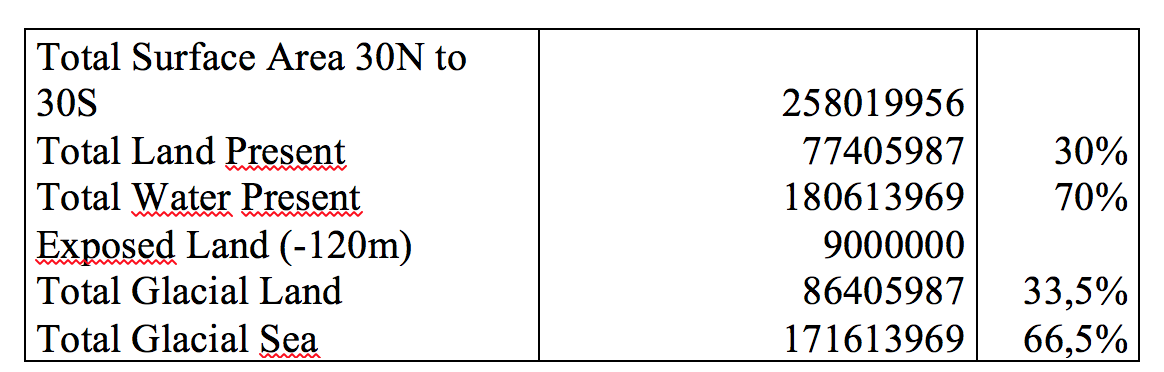
At low sea stands the world is a very different place: although parts of today’s temperate zones were under ice, whole new areas appeared in the tropics. Total land and sea areas (km2) between latitudes 30N and 30S are shown in Table 2.
Table 2. Surface Areas in km2 between 30 Degrees (N and S) Present Sea Level and Glacial (-120 m)
At Glacial Maximums the land area is thus increased by 3.5% and thus the difference between present and glacial land and sea areas thus changes by 7%. This not only has an enormous effect on the evaporation of water vapor, but also affects the overall air pressure levels over ‘dry’ land.
The original research into glacial era air pressure was carried out by Marie-Antoinette Mélières in 1991 (3) which looked at the changes in atmospheric mass. This paper makes a series of assumptions in order to arrive at the conclusion that pressure was approximately unchanged. However, some of these assumptions are not true, in particular: a) that land area remains constant and b) that the question is not related to a fixed reference point on present dry land (which is effectively uplifted above sea-level).
2.1 Air Sequestration
Ice caps not only lock away water as they develop in area and depth, they also entrap air. Freshly fallen snow is composed of about 70% air by volume and compacted snow (firn) about 50%. At Byrd Station, Antarctica, this firn transforms into ice at about 56 m depth with a gradual ‘close-off’ of porosity. The ice at this stage “contains approximately 10 per cent air by volume in the form of discrete bubbles.” (4). At this point this air is effectively removed from atmospheric circulation. These bubbles are reduced in size as internal pressure increases until in the deeper and bubble-free ice below 1200 m air entrapment ceases to be in bubble form and the gas molecules are dissolved in the ice as hydrates (5).
Under present-day climatic conditions, the air content of polar ice generally shows a high sensitivity to the atmospheric pressure and hence to the surface elevation of the ice sheet where the ice is formed (6). There is also a high variability in samples with higher average air content taken from Alaska, which may reflect that the effective pore close-off happens at a shallower depth. (In this case, insolation may be a factor that leads to the formation of ‘lids’ in layers with high air density, thus trapping the air below) (7).
When sea levels dropped by 120m over 70% of the surface of the earth, this water was locked into the ice caps, hence the volume of this new ice on land (specific density of ice/firn = 0.9) would have been around:
Surface of the Earth (SE)* 120m* 0.7/0.9 = SE*93 m3
This ice built up over land masses and continental shelves at lower heights; hence the air volume was slightly higher than the 10% formed at altitudes of 3000 m on the Antarctic and Greenland ice caps (where most ice-core drilling has taken place). Based on Alaskan samples this air represents some 12-13% at a close-off pressure of some 1.2 atmospheres. Thus the volume of trapped air would be 12-13%*1.2 or some 15% of this volume:
SE*93*0.15 = SE *14 m
To this must be added the air sequestered in the extensive marine and marine-grounded ice which did not cause a drop in sea level. This has been considered to be about 50% of the land ice. Hence the ‘removal’ of a ‘layer’ of air which when corrected for sea level at 1 bar is the equivalent of a drop in atmospheric pressure of some 20 m.
2.2 Isostatic Deformation
Although the volume of closed-off ice is very similar to the volume of water ‘lost’ from the sea, the concentration of land ice in very thick deposits had a significant isostatic effect on these land areas, forcing the land – through elastic and viscous mantle flow – to deform and sink. During a maximum glacial event, about one fifth of the SE was under ice – about two thirds of this over land or marine grounded. Taking 100 m as a working estimate for average deformation, this volume had to be filled with air molecules causing a further drop in global atmospheric pressure. At 1bar, this is equivalent to an altitude of about 10 m.
2.3 Water Vapour and Air Pressure
Dry air is denser than moist air in the present climate. However, when there is a massive global reduction in water gas molecules (as more dry land is exposed and vapor trapped in ice), overall atmospheric pressure drops.
The first cause of this decrease in water vapor is due to the fall in surface sea temperatures (SST) which lowers the value for saturation of water in air. SST levels fell by some 3-5 C over the latitudes +30 to -30 thus saturation fell from around 1.8% (at 21C) to 1.6% (at 16C): a decline of 11% (8, 9).
The second reduction is due to the overall global dry conditions as vapor is locked away as ice, more land exposed and less tropical sea areas exposed to evaporation. An approximation of this effect has been made of an extra decline of 20%. Thus if the average number of water gas molecules presently in the atmosphere is about 2% (NASA), the total drop in water molecules in the atmosphere during glacial periods would be about 11%(SST)+ 20% (Dryness)=31%. At a density of 0.804 g/l (in comparison with that of dry air at 1.27 g/l at STP), this is equivalent to a loss of atmospheric pressure of 2%*0.31* 0.804/1.27 = 0.4%. This is equivalent to an elevation of about 45m. Dr Mélières presents a lower figure of about 1hPa, the equivalent of 10m (3).
2.4 Lower Sea Levels = Lower Air Pressure over Present Day Landmasses and increases Thermal Feedback
During the stable glacial maximums, the present day coastlines were 120 m above sea level. Thus the drop in air pressure over present land expressed in equivalent present day height above sea level would be:
- 120 m (drop in sea level) +
- 20 m (air sequestration) +
- 10 m (glacial deformation) +
- 45 m (loss of gaseous water)
=195 m.
For cold, dry air, this drop in pressure signifies a drop in temperature of about 2 degrees Celsius.
This process also has a feedback effect:
- as cooling starts, ice caps develop → air sequestered
- sea levels drop → ice loading → deformation
- reduction in gaseous water → resulting drop in air pressure
- lower air pressure→ further cooling, etc.
The reverse is also true: during a warming event, ice melts and releases air and sea levels rise, all leading to even more warming.
- Carbon: Slowly Taken Out During Cooling and Rapidly Pumped Back During Warming
With sea levels at -120 m, most of the new dry land exposed between +/-30 degrees latitude would have been gradually ‘colonized’ by neighboring tropical forests, first by swamps and then after desalinization by fully developed forests. Some of these areas would be debatable, however, the Persian Gulf lands would be part of the Mesopotamian delta and the Red Sea was probably within the ‘green’ Sahara belt and would be lush rather than deserts. Other Continental Shelves may have been savannahs, however, most of the lands in the Gulf of Mexico were close to Florida, Yucutan and Vera Cruz.
An evaluation of several studies has shown that Equatorial Tropical Forest contains about 200 tons of carbon per hectare (10); this also being the value quoted by the IPCC (2006). More recent studies analyzing the diversity of tree species in relation to total carbon (11) have confirmed these values, although in South America the value is slightly lower, possibly due to large tree removal in the recent past.
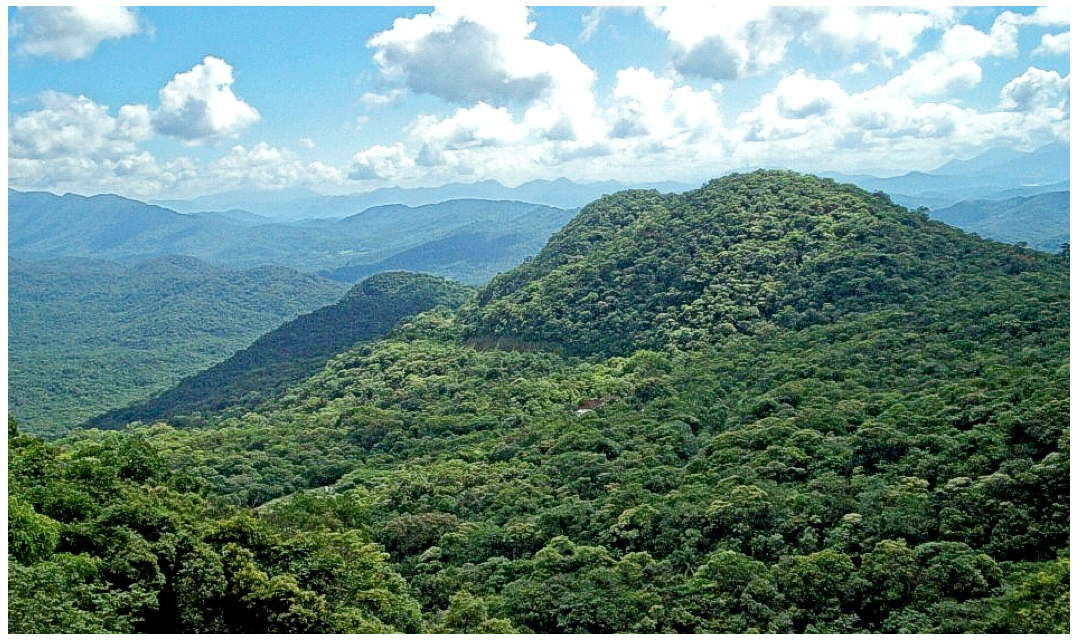
The process of forest growth would have been slow as, meter by meter, land was reclaimed from the sea. Although present land would be getting progressively cooler as air pressure dropped, this new land would still have been mainly tropical: Figure 3 shows the Atlantic Rain Forest in Southern Brazil flourishing at 800 m, 5 to 6 C cooler than at sea-level and subject to winter frosts.
Fig. 3 Atlantic Rain Forest at Altitude
Eventually about 150 billion tonnes of carbon would be fixed in these new forests, along with the carbon fixed in the soil – estimated at about 50 tonnes/ha for low tropical altitudes (12). This totals close on 221 billion tonnes of carbon, or approximately the equivalent of 650 billion tonnes of CO2. The present mass of carbon dioxide is given as 3200 billion tonnes, so taking the mass of atmospheric CO2 during MIS 3 to be around 2000 billion tonnes, this CO2 capture in the new lands at low level is of the order of 25 to 30% of the available CO2 in the atmosphere. Again we may assume a feedback process: as more carbon is sequestered by the new forests there would be more gradual cooling.
The reverse is slightly different: once the globe starts to warms and sea levels start to rise rapidly at about 2 m per century, these forests would first die-off as salt water reaches the roots, then be partly submerged in tidal sea water and subjected to wave action – during this time the dead wood would have been eaten by fungi in aerobic conditions and producing mainly CO2. Final breakdown would have taken place by the action of worms, shellfish, bacteria, etc., releasing vast amounts of stored carbon in the form of CO2 and methane.
The resulting beaches, mud flats and sand dunes would in turn be gradually submerged and it is assumed that the residual carbon in these drowned biomes would have been low, as sand dunes only have a carbon content of about 3.6 tonnes/ha (13). The main difference between the colonization of reclaimed lands and their loss by sea rise is, of course, the rate at which it happens. Forests rot much faster than they grow and a tropical/subtropical area the size of Brazil would have been submerged in just a few thousand years. This hypothesis (and we can take as given that there were vast new lands, vast new tropical forests and a rapid loss of nearly all the carbon at the start of the Holocene) implies a lapse of several hundred years between temperature (and sea-level) rise, and the final release of the stored carbon. Again this is a much quoted point of discussion and the author hopes that further work on the rate of carbon released (roughly equivalent to the surface area inundated over time) may correlate with the Warming Pulse 1A.
References [references ]
addl ref added:
Leite et al, Forest expansion during the last glacial period PNAS 2016, 113 1000-1013; DOI:10.1073/pnas.1513062113
.
Biosketch: Alan Cannell, Anglo-Brazilian Engineer (Urban Design and Transport), Member of the Italian Institute of Human Paleontology (ISIPU). Objective is to examine questions related to Paleoanthropology from an engineering point-of-view, highlighting topics that may have been overlooked yet interest the professionals.
Moderation note: As with all guest posts, please keep your comments civil and relevant.