by Tony Brown
This article examines the continued cooling of CET this century
- Looks at a similar scenario of regional cooling in America
- Examines CET related urbanisation issues, and the current Met office allowances for this
- Notes the centuries long general warming of our climate.
- Notes considerable English seasonal variability over the centuries
- Examines the key component parts of the weather that affect the British Isles
- Queries whether wind direction, strength and longevity are major factors in shaping our climate over the centuries.
Note: Weather comprises the day to day events that we all experience. Climate is officially the trend of the weather (often temperature and rainfall) taken over a continuous thirty year period. The two terms have sometimes been used in an interchangeable manner here, when a period of more than a year is being examined.
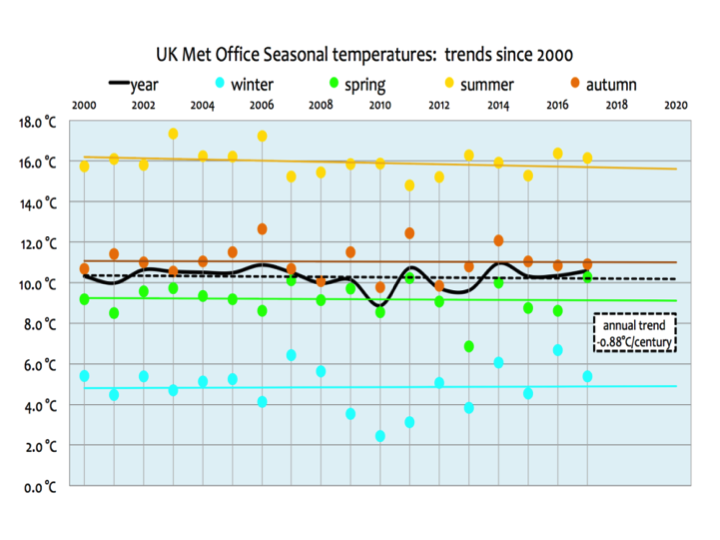
Some two years ago I wrote this article The Rise and Fall of Central England Temperature. This article commented on the interesting-but not climatically valid-observation that no one born in England this century has known warming; in fact there had been a slight decline in temperatures, albeit still maintained at a historically high level.
This data – using Central England Temperature (CET) which is maintained by the Met Office – has now been updated to the end of 2017 as shown in Figure 1. It shows this decline continuing, although recent warm seasons have slightly reduced the downwards trendFigure 1
To put this into a much broader context, here is the seasonal data from the start of the CET record in 1660.
Figure 2
Figure 2a linked here [2a ], shows the seasonal temperatures in much greater detail.
The recent cooling was interesting, as it appeared that CET fitted into the pattern of an earlier article I co-authored with Verity Jones In Search of Cooling Trends.
This graphic shows some of the stations identified as cooling over the statistically meaningful period of at least 30 years
Figure 3
The take home message was that whilst undoubtedly most stations around the world had warmed in recent decades, it could be observed that there were large warming AND cooling trends in many places. With regards to cooling, some one third of stations worldwide showed a trend that was downwards, rather than upwards. This was confirmed by Richard Muller of the BEST project several years ago in a personal email, but it must be said there are many caveats to this observation, especially as regards the length, amount and consistency of this cooling.
In 2016 Professor Muller wrote an article in which he observed the areas of sustained cooling in America;
Figure 4
He wrote [link]
“I attach a plot that shows climate around the US. The blue circles show locations where the trend line has indicated cooling weather over the last 100 years. The red crosses show where it has warmed. The fact that ⅔ of the spots are warming illustrates that global warming is real, although to be careful and scientific we have to avoid the heat island effects (not part of global warming) and average equally over all land and sea. The cooling parts on the map don’t indicate that the world is cooling, but only that local variability in climate is still larger than the global warming trend.”
Now neither America nor England constitutes the entire world land surface of course, but both countries have especially good weather records. In Britain’s case, the temperature records go back to 1659, which I reconstructed further back to 1538 in this article from 2011 The Long Slow Thaw.
This showed the oscillation of temperatures throughout the period and in particular the depths of cold in the ‘Little Ice Age.’ (The results can be seen in Figure 6, below.)
The keepers of the CET records-the UK Met office had recognised that since its inception over 350 years ago, Britain – and more specifically England – had become much more urbanised and accordingly made adjustments to the temperatures in recent decades to compensate. In the ‘Long Slow Thaw’ I wrote this:
‘The modern era of CET is potentially showing the effects of needing a uhi adjustment greater than the Met office currently apply. * However, as we had earlier observed that instrumental records should not be considered accurate to tenths of a degree we are perhaps splitting hairs. Consequently, more accurately we should observe that the ‘direction of travel’ of temperatures, when combined and constrained by historic records, shows that at several points from 1538 there are similarities to the modern era as regards warm periods.”
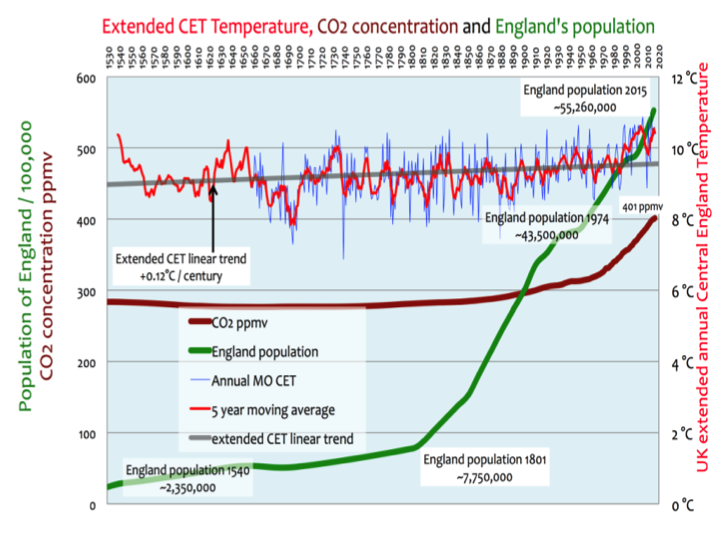
*Note; Since 1974 the data have been adjusted by the Met Office to allow for urban warming: currently a correction of -0.2 °C is applied to mean temperatures. The context of this UHI adjustment can be seen in this graphic showing population growth.
Figure 5
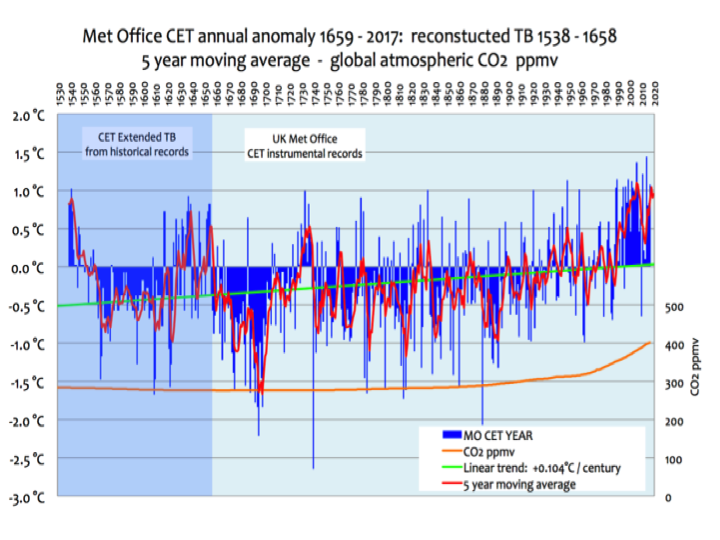
The same data is shown below, excluding the population data which somewhat distorts the axis of the graphs
Figure 6
In considering the urbanisation factor used, it can be noted that the current population of Greater London is the same as that of the whole of England 200 years ago. The population has increased some 25% since the UHI adjustment was first made in 1974. Some 60% of the population of England lives within an hours’ drive of the Peak district which can be considered the area CET is centred on. One of the stations used in recent times, Ringway, was situated near a rapidly expanding airport. It was retired in 2004. England at 130,000sq km and a population of 55 million, is less than the size of New York state at 141,000sq km with a population of 20 million. So England, with its small size and large population could be considered one large heat island with the CET stations in the middle of it.
In consequence there appears to be a reasonable possibility that a further adjustment needs to be made to the urbanisation factor, which might slightly affect that characteristic ‘hump’ from 1990 clearly seen in Figure 6. In recent emails with the Met office I understand that during 2017 they carried out some work with regards to re-evaluating the CET daily and monthly series and current urbanisation adjustments have been revisited.
The result is that a new version of CET with supporting documentation is currently being formulated. Any differentiation with the existing series will need to be scientifically justified. Making any adjustments to the world’s longest running temperature series is not undertaken lightly, so it is unlikely we will see the results of this investigation in the near future. The immense amount of scientific analysis that goes into making adjustments to the record can be seen in this 2005 paper written by Met Office authors [link].
So it may end up that the urbanisation corrections could be larger for more recent years, but to comment on the likely adjustments, if any, would be mere speculation at this point.
Setting that issue aside for the time being, we can extract a variety of other data from an analysis of the seasons.
Figure 7
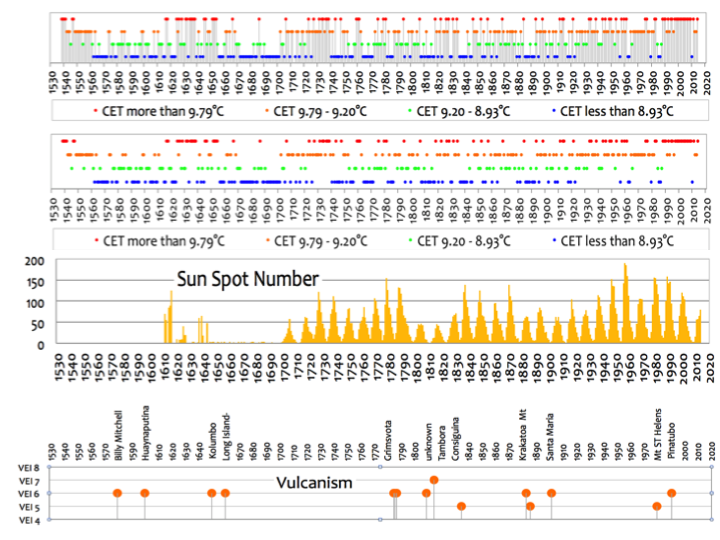
The coloured dots in Figure 7 highlight those ‘exceptional seasons’ that are at least 1.5C warmer or colder than the 5 year moving average. With a rising trend virtually from the start of both the official and extended record, fewer seasons would be counted as exceptional at the end, than at the start, of the graphic. However, that early era was said to be amongst the coldest periods in the Holocene- and should not be considered ‘normal’.
It was from around 1550 that some of the most severe periods of the LIA, with considerable glacier growth, appear to have occurred. This is illustrated in Figure 8 whose data was derived from a variety of sources including ‘Times of Feast, Times of Famine’ by E Roy Ladurie. Onto it has been superimposed extended CET. As can be seen from this graphic and the data noted in the other graphics, glacier growth or retreat does not necessarily occur only during short and sporadic periods of constant cold or warmth, but from the dominant weather characteristics of the entire period.Figure 8
Looking again at Figure 7, what is notable is that even in the cold early period there were many mild winters. CET has a relatively small temperature spread with the greatest differences generally occurring in winter and summer and it can be readily seen that a mild winter can distort the year’s average. This most recently happened in 2015 when a fairly cool year up to then was changed by one of the warmest Decembers on record. Similarly a cold season, especially a winter, can cool down the year. If there are two or more exceptional seasons in the same year that will have a considerable impact on the average temperature of that year.
It is highly unusual for three or more seasons in one year to exceed these ‘exceptional’ temperatures, when they do, it is invariably marked by an exceptionally warm or cold year.
In Figure 9 (below) I examined the data covering the period 1538 onwards, with a particular view to looking closely at the especially cold periods. The rather vague term ‘Little Ice Age’ is something of a misnomer and is often generally applied to the exceptional cold that was thought to have lasted from around 1250 to well into the 19th century. The period around Dickens birth, his evocation of devastatingly cold winters, together with Napoleons retreat from Moscow, beaten by ‘General Winter’ are high profile examples of the latter part of this extended cold period. However, that is not the whole picture, as there were surprising interludes of considerable warmth throughout the ‘LIA’ as I noted in this article on The Intermittent Little Ice Age.
Figure 9 that follows is taken from this article.
Figure 9
The criteria for the temperature of years – ranging from warm red through to cold blu e- is shown in the legend heading the graphic. From this it can be seen that there were warm years, many moderate years, many cool years and many cold years, with the latter mostly being in the first two thirds of the period, the warm moderate years being well spread out (with a definite grouping around 1730 and especially at the end) and numerous cool ones, which again taper off towards the end. The suggested warmth at the (reconstructed) start around 1540 is tantalising and is better seen in context in Figure 6. This was said by some chroniclers to include the hottest and driest spring, then summer on record, followed by the warmest winter ever and an equally dry and hot spring and summer and autumn the following year.
The three years prior to this had also been exceptionally warm, as described in 6 of the Most Catastrophic Weather Events in British History.
What can we make of the overall extended historic picture when looking at the seasons and the individual years, augmented by the vast amount of literature and scientific studies, much of it referenced in the appendices of the articles cited above? It is that seasons, and no doubt very exceptional months, can affect the character of a year. That is to say, short periods of ‘weather’ are important in our understanding of the ‘climate’. The apparent deep freeze of the LIA from 1250 and lasting 500 years or more can be seen to be a chimera. Some winters were exceptionally cold but other seasons, and some winters, were as warm as their modern day counterparts.
There was no constant settled pattern but rather a mosaic of continually varying months, seasons and years, which at times produced a dominant theme, whether hot, cold, wet or dry, but was then replaced by another dominant theme that might be quite different. Whilst overall the cold might outweigh the warm, and this is especially so in some very defined periods, it was by no means a constant deep freeze, hence my use of the term ‘Intermittent Little Ice Age.’
What factors can dramatically affect the overall temperature record and the ‘climate’ over relatively short periods of months, a few seasons or a few years and thereby potentially shape our perceptions of an era? Two high profile possibilities are volcanic eruptions and sunspots;
Volcanic eruptions
The emissions can stay in the atmosphere blocking the sun which, depending on the season, may have a catastrophic impact in England or the near continent on the growing or harvesting of crops or vines, both of which have extensive centuries old records attached to them. In the case of crops, manorial records dating back to the 13th century are available and with grapes Le Roy Ladurie’s ‘Times of Feast, Times of Famine’ details the good and bad years dating back many centuries. These, amongst other records, can give a good indication of the likely real world impact of a major volcanic eruption, although its geographic location, prevailing winds and volume of emissions are key.
However, whilst undoubtedly a short term factor that can impact on temperatures of single months or even seasons, the longer term impact of volcanoes is perhaps exaggerated. As an example, the super volcano Mount Rinjani eruption -probably May to Oct 1257- was said by some scientists to have caused weather chaos for years around the world and even precipitated the first major phase of the LIA. [link]
However, detailed comments in Note 1 [Note 1], taken from contemporary English accounts, shows that this view is possibly misplaced:
Laki in Iceland erupted in June 1783 and continued sporadically until March 1784. [link]
There was a very hot summer in 1783 after some very mixed and often exceptionally wet weather in the preceding years and early snow in parts of the country. Then the annals of Exeter cathedral note:
1783 ‘Extra poor relief in extreme cold’
The grouping of cold seasons around that 1783 period appears to show emissions impacted on England for around a year or two, assuming these cold seasons were volcano related and not connected to what had caused the earlier unsettled weather. However, the decades before the eruption appear to show an unsettled period was already long established.
This is not to say that severe volcanic eruptions have no impact on weather, but that their impact may be overstated at times and such eruptions appear unlikely to have precipitated long term changes in the climate.
Sunspots
Sunspots are also often highlighted as prime causes of catastrophic changes in the climate that can cause a cold regime. Looking at CET there appears at first sight to be a reasonable correlation with the Maunder minimum around 1645 to about 1715 and the Dalton minimum around 1790 to 1830. However, an examination of the detailed record (see Figure 9) illustrates there were many warm seasons mixed in with the cold ones, so if sunspots did have an impact it was a sporadic one, or they were merely one of a number of possibly unrelated factors that affected the climate. Some very cold winters also often fall outside of known sunspot minima.
Other factors
Other factors that may influence the weather and climate to a greater or lesser degree include the strength and frequency of ocean events such as an El Nino or La Nina, the subsequent temperature of the oceans, strength of currents such as the ‘Gulf’ stream, Co2 levels, Cosmic rays, amount of sunlight, pollution and cloud cover, wind direction and perhaps extended periods of the chilling effects of a SSW (Sudden Stratospheric warming) possibly causing a break up of the polar vortex. So all in all there are a number of factors that shape our short term weather and may contribute towards longer term changes. Some, such as volcanoes and sunspots appear to probably have a passing and sporadic -although often very important- impact, rather than a long lasting one.
A SSW event can reverse the jet stream and in winter create intensely cold easterlies in contrast to the prevailing mild and wet westerlies in the UK. So in this scenario there are three broadly related factors; SSW’s , prevailing wind directions and the position of the jet stream, that are perhaps overlooked in their influence in shaping not only our weather but, over the longer term, the climate.
People have been studying the winds for years and there are numerous historic records concerning them. Information on the jet stream and SSW’s is mostly confined to more modern periods.
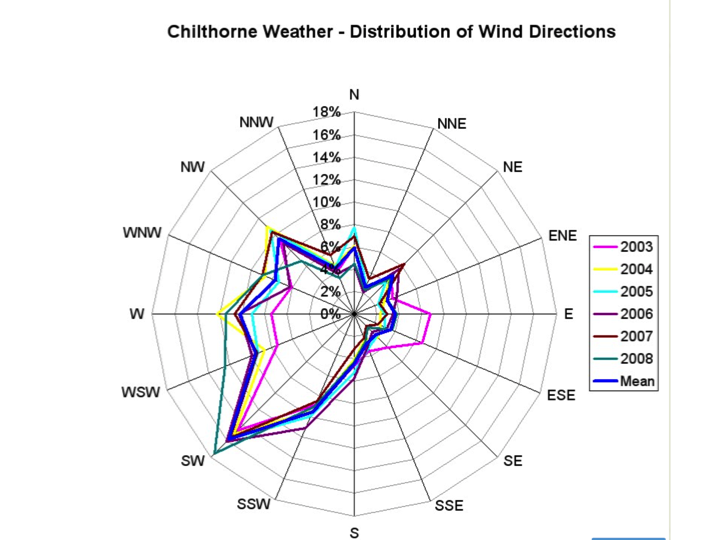
Anyone who has visited the exposed west coast of Britain will have seen the trees bent over in confirmation of the prevailing South westerly winds shown in the ‘wind rose’ (figure 10) taken at Chilthorne in Somerset in the West of England.
But what happens when those predominant ‘warm wet westerly winds’ stop blowing for a protracted time – for whatever reason – and are replaced by those from other directions? Could it cause a fundamental regime change in our climate – such as one of the intermittent periods of the LIA – that can be picked up in the records?
The possible impact of winds as a major factor in shaping the British weather and climate over the long and short term is the subject of part two of this study.
Figure 10
To summarise
The CET record demonstrates an interesting – but not climatically significant – decline since the turn of the century.
It also demonstrates that CET temperatures remain at a historically high level
A minority of countries or regions around the word have also experienced temperature declines of varying amounts and longevity, such as in America
The historic record appears to show evidence of enhanced urbanisation which may not be currently fully reflected in the appropriate CET adjustments by the Met office
There are potential historic siting concerns of one of the three stations generally used in CET although this station was removed several years ago.
The Met office appear likely to be releasing a new CET series that will account for some of these concerns
We can determine that the extreme seasons have lessened over the centuries, although that is partly an artefact of the rising temperature trend
We can see that exceptional seasons or months can affect the characteristics of a year or of a longer period
We can also see that the temperature has been generally rising throughout the official and extended CET record. If CET is an accurate global or Northern Hemisphere proxy (see Section 6 of the ‘Long Slow Thaw’) then it appears that we are experiencing a global warming trend of some centuries and the Global records from 1880 can be seen as a staging post and not the starting post for this rise.
We can determine that the Little Ice Age was rather intermittent, rather than continuous over hundreds of years and that individual factors such as volcanoes or sunspots do not always explain the marked changes in temperatures up or down.
Whether wind direction is a major factor in the intermittent Little Ice Age and in other periods through the CET will be the subject of a further paper.