Several weeks ago, a new article (open access) on Sheep Mountain (Salzer et al 2014 , Env Res Lett) was published, based on updated (to 2009) sampling at Sheep Mountain.
One of the longstanding Climate Audit challenges to the paleoclimate community, dating back to the earliest CA posts, was to demonstrate out-of-sample validity of proxy reconstructions, by updating inputs subsequent to 1980. Because Graybill’s bristlecone chronologies were so heavily weighted in the Mann reconstruction, demonstrating out-of-sample validity at Sheep Mountain and other key Graybill sites is essential to validating the Mann reconstruction out of sample.
The new information shows dramatic failure of the Sheep Mountain chronology as an out-of-sample temperature proxy, as it has a dramatic divergence from NH temperature since 1980, the end of the Mann et al (and many other) reconstructions. While the issue is very severe for the Mann reconstructions, it affects numerous other reconstructions, including PAGES2K.
Salzer et al 2014
Salzer et al show eight Sheep Mountain chronologies for 1600-2009 (their Figure 6), showing variations over four elevations (treeline, minus 30 meters, minus 60 meters and minus 90 meters) crossed by exposure (north-facing, south-facing). They report material differences between the chronologies and conclude with a recommendation that specialists take altitude and exposure into consideration in constructing chronologies. (The failure of dendro specialists to document such information has been a longstanding criticism here.)
In their Figure 5, they zoom in on two treeline chronologies (north-facing (blue) and south-facing (red)) in the period 1980-2009, observing that there is a divergence between the two chronologies, with the south-facing chronology declining relative to the north-facing chronology. The 1980 startpoint, by coincidence, is the endpoint of the Mann reconstruction – thus there is no overlap between the chronologies shown below and the chronologies used in Mann et al 1998-1999. Note that some very recent SFa values are below the long-term mean (1).
Figure 1. Salzer et al 2014 Figure 5, showing treeline north-facing (NFa -blue) and south-facing (SFa -red) chronologies for 1980-2009. This information was digitized for use in Figure 2 comparisons.
Comparison to Graybill Chronology
Unfortunately, Salzer et al did not compare their new data to the chronology versions used in Mann et al 1998-99, Mann et al 2009 and many other multiproxy reconstructions.
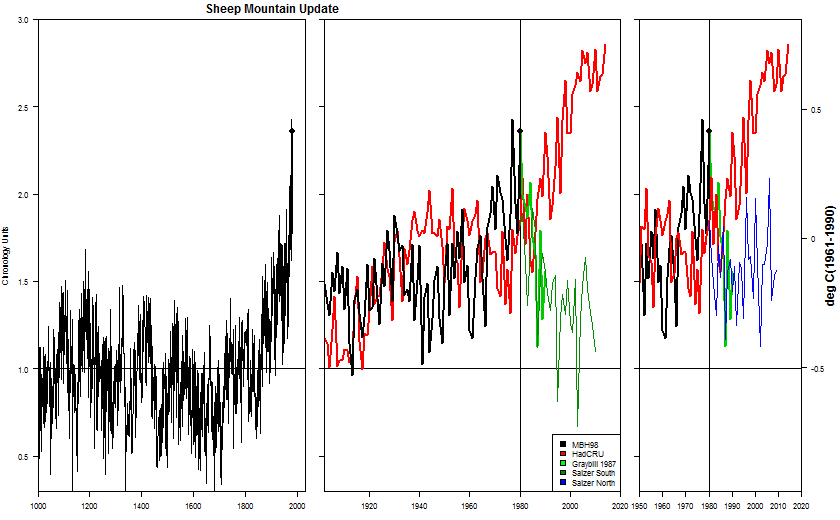
In the Figure below, I’ve started with the Sheep Mountain chronology as used in Mann et al 1998 (left panel). As CA readers are aware, it has a very dramatic HS-shape and is heavily weighted in the MBH reconstruction. Indeed, without the Graybill bristlecones, the MBH reconstruction is basically noise. In the middle panel (1902-2009), I’ve added chronology updates (green) and HadCRU NH (red).
For comparison, the HadCRU NH temperature data is scaled here so that its mean and standard deviation match the Graybill Sheep Mountain chronology in the MBH98 1902-1980 calibration period. The original Graybill Sheep Mountain chronology ended in 1987 (rather than 1980) and, though little discussed previously, actually declined quite sharply in the 1980s. The updated Salzer SFa chronology is shown in thin green and, while slightly elevated relative to the thousand-year mean, also shows a dramatic decline from the closing values of the series used in Mann et al 1998. While the Salzer NFa chronology (right panel – blue) is slightly elevated relative to the SFa chronology and to the millenium mean, its values are also much lower than closing MBH98 values of the Graybill chronology.
Both diverge dramatically from the NH temperature. To have kept pace, SFa and NFa chronology values ought to have reached nearly 3, while the SFa chronology has almost reverted to the long-term mean, with several recent values actually below the long-term mean. Perhaps this accounted for the interest in looking at north-facing exposure separately.
CLICK!
Figure 2. Comparison of Sheep Mountain (black-green-blue) and HadCRU NH (red). Left – Sheep Mountain (ca534) as used in Mann et al 1998-99; middle – Sheep Mountain updates, showing both post-1980 Graybill values and the Salzer 2014 NFa values (green); right – with Salzer 2014 SFa (blue). HadCRU NH scale chosen to match mean and standard deviation of chronology in 1902-1980 calibration period.
Discussion
In the financial world, analysts are accustomed to supposed models/systems of the stock market that are highly tuned to historic data and which fail out of sample. With this example very much in mind, one of my very first challenges to the paleoclimate community was to demonstrate out-of-sample validity of the multiproxy reconstructions (mentioning Moberg et al 2005; Mann et al 1998-99) by bringing their inputs up-to-date. Because the Mann and other reconstructions ended in 1980, I observed that the records could be readily updated and confirm whether the linear combination of proxies in the various steps of, for example, the Mann reconstruction were valid measures of temperature out-of-sample, writing as follows at the time:
One of the first question that occurs to any civilian becoming familiar with these studies (and it was one of my first questions) is: what happens to the proxies after 1980? Given the presumed warmth of the 1990s, and especially 1998 (the “warmest year in the millennium”), you’d think that the proxy values would be off the chart. In effect, the last 25 years have provided an ideal opportunity to validate the usefulness of proxies and, especially the opportunity to test the confidence intervals of these studies, put forward with such assurance by the multiproxy proponents.
Being suspicious of over-tuning and data-snooping, I speculated at the time that the so-called proxies would not work well out of sample:
What would I expect from such studies? Drill programs are usually a surprise and maybe there’s one here. My hunch is that the classic proxies will not show anywhere near as “loud” a signal in the 1990s as is needed to make statements comparing the 1990s to the Medieval Warm Period with any confidence at all.
The new results of Salzer et al 2014 (though not candid on the topic) fully demonstrate this point in respect to Sheep Mountain. In the warm 1990s and 2000s, the proxy not only doesn’t respond linearly to higher temperatures, it actually goes the wrong way. This will result in very negative RE values for MBH-style reconstructions from its AD1000 and AD1400 networks when brought up to date, further demonstrating these networks have no real “skill” out of sample.
We’ve also heard over and over about how “divergence” is limited to high-latitude tree ring series and about how the Mann reconstruction was supposedly immune from the problem. However, these claims mostly relied on stripbark chronologies (such as Sheep Mountain) and the validity of such claims is very much in question.
As previously discussed on many occasions, stripbark chronologies have been used over and over in the canonical IPCC reconstructions, with the result that divergence problems at Sheep Mountain and other sites do not merely impact Mann et al 1998-99, but numerous other reconstructions. Even the recent PAGES2K North America reconstruction uses non-updated Graybill stripbark chronologies. It also ludicrously ends in 1974. So rather than bringing the Mann et al network up-to-date, it is even less up-to-date.
Nor can the original challenge to demonstrate proxy validity out-of-sample be met with a new reconstruction using different proxies (such as Kaufman’s muds, upside-down or not). Financial analysts are used to this sort of switch, also discussed in an early CA post here, about the interaction between data mining/snooping and spurious regression, in which I quoted Ferson et al 2003 (which is about financial instruments) but with data snooped paleoclimate reconstructions in mind:
The pattern of evidence in the instruments in the literature is similar to what is expected under a spurious mining process with an underlying persistent expected return. In this case, we would expect instruments to arise, then fail to work out of sample…
With fresh data, new instruments would arise then fail; the dividend yield rose to prominence in the 1980s, but fails to work in post-1990 data. The book-to-market ratio seems to have weakened in recent data, With fresh data, new instruments seem to work. There are two implications. First we should be concerned that these new instruments are likely to fail out of sample. Second, any stylized facts based on empirically motivated instruments and asset pricing tests based on such tests should be viewed with scepticism.
CA readers will also be aware of earlier discussions (see tag) of Ababneh’s Sheep Mountain reconstruction, which had previously failed to replicate the huge HS of the Graybill chronologies.
Alert CA readers will also recall that Jacoby distinguished between north-facing and south-facing chronologies in his original work, but focused mainly on south-facing chronologies. (CA readers are aware that Jacoby selectively reported and archived only the most “temperature sensitive” chronologies.)
Salzer has not yet archived data for this article. He’s got a pretty good record of archiving and I anticipate that it will be archived, but the unavailability of data at the time of publication is a pernicious practice.