by Judith Curry
My new talk on improving seasonal to interannual climate predictions.
This week, I am attending the Weather Risk Management Conference (WRMA) in Miami.
Utility of climate forecasts for risk mgt
In providing forecasts for the private sector, I’ve come to realize that there is a gap between climate forecast information and the needs of users. Even if the scientific community believes certain information is valuable, users may not. There is also a gap between how users value forecast information compared to its quality.
CFAN has focused its forecast efforts on bridging this gap, by providing predictions of extreme eventsand objective assessments of forecast confidence.
Ensembles and probabilistic weather forecasting
This figure illustrates the concept of probabilistic weather forecasting, using a global ensemble model prediction system.
For each forecast, the global model produces an ensemble of multiple forecasts, initialized with slightly different conditions. The ECMWF model has an ensemble size of 51 forecasts. A single forecast (say the gold dot) may be rather far away from the actual observed outcome (the red dot). If the ensemble is large enough, meaningful probabilistic forecasts can be provided. The objective of the probability forecast is to bound the observed outcome (the red dot) in a probability space (reflected by the darker blue region) that is much smaller than climatology (the lighter blue region).
The actual model prediction is characterized by the green region. The potential predictability of the model is characterized by the dark blue region. This potential predictability can be realized in a prediction through forecast calibration and ensemble interpretation techniques.
Ensembles and probabilistic climate prediction
The challenge for probabilistic climateprediction is that in order to encompass the observed outcome, the ensemble size needs to be very large and becomes as large as the climatology. The challenge is even greater when climate is changing, such as the slow creep of global warming or an abrupt shift in a climate regime such as the Atlantic Multidecadal Oscillation.
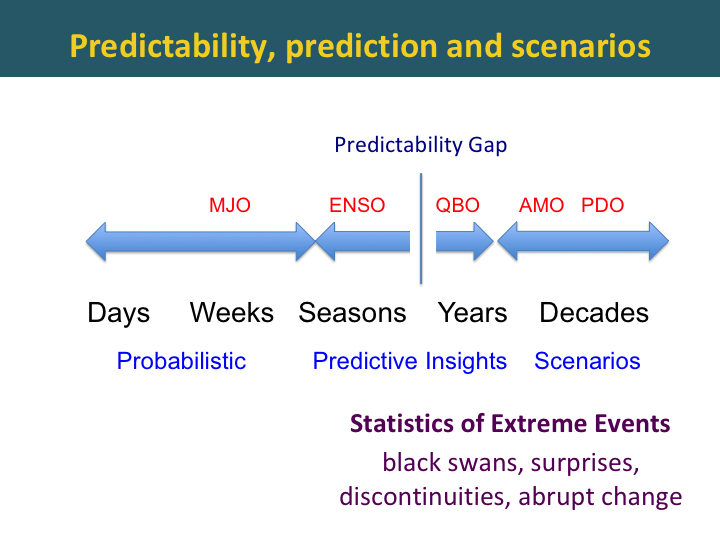
Predictability, prediction and scenarios
For weather prediction timescales of 2 weeks or less, ensemble prediction methods can provide meaningful probabilities. This time horizon is being extended into the subseasonal time frame, potentially out to 6 weeks. However forecasts beyond two months often show little skill, and probabilistic forecasts can actually mislead decision makers. On seasonal time scales, predictive insights are typically provided, whereby a forecaster integrates the model predictions with an analysis of analogues and perhaps some statistical forecast techniques.
A predictability gap is seen around 1 year, where there is very little predictability. At longer time scales some predictably is recovered, associated with longer-term climate regimes. However at longer time horizons, predictions become increasingly uncertain.
Possible future scenarios can be enumerated but are not ranked, e.g. because of ambiguity.
A useful long range forecast keeps open the possibility of being wrong or being surprised, associated with abrupt changes or black swan events. Anticipating abrupt changes or black swan events would be most valuable.
The key forecasting challenge is is to extend the time horizon for meaningful probability forecasts, and to extend the time horizon for predictive insights of the likelihood of future events.
How can we extend these forecast horizons?
ECMWF ENSO prediction skill
Improvements to global climate models are helping extend the time horizon for meaningful probabilistic forecasts.
This slide compares El Nino Southern Oscillation forecasts from the latest version of the European model with the previous model version. The y-axis is the initialization month, and the x-axis represents the forecast time horizon in months. The colors represent the strength of the correlation between historical forecasts and observations.
The most notable feature of this diagram is the spring predictability barrier. If you initialize a forecast in April, it will rapidly lose skill by July, and the correlation coefficient drops below 0.7 (which is reflected by the white region). However, if the forecast is initialized in July, the forecast skill remains strong for 7 months and beyond.
The skill for the new version of the ECMWF forecast model is shown on the right, and we see substantial improvement. While the color schemes are slightly different, you can see that the white region, indicating correlation below 0.7, is much smaller, indicating that the model performs much better during the springtime predictability barrier.
The improved skill in Version 5 is attributed to improvements to the ocean model and also to parameterizations of tropical convection.
Climate prediction: signal to noise problem
On timescales beyond a few weeks, the challenge is to identify the predictable components. Predictable components include
- Any long-term trend
- Regimes and teleconnection patterns
- And any cyclical or seasonal effects
Once you identify and isolate the predictable components, you can ride the wave.
The challenge is to separate the predictable components from the ‘noise’. These include
- Unpredictable chaotic components
- Random weather variability
- Model error
The biggest challenge is regime shifts, particularly when the shifts were triggered by random events. You may recall that in 2015, it really looked like an El Nino wanted develop. However, its development was thwarted by random but strong easterly wind outburst in the tropical Pacific. This failed 2015 El Nino set the stage for the super El Nino of 2016.
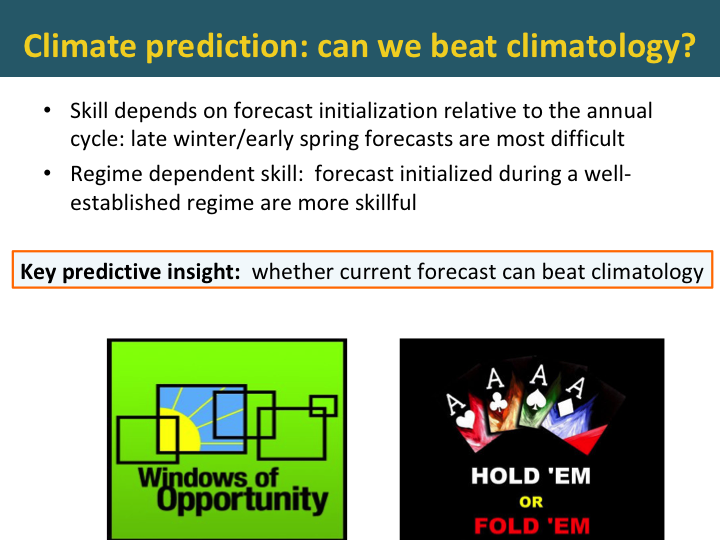
Climate prediction: can we beat climatology?
The big challenge in making a climate prediction is whether you can beat climatology. Forecast skill depends on several things.
When the forecast is initialized relative to the annual cycle is an important determinant of skill. Also, a forecast initialized during a well-established regime, such as an El Nino, are more skillful.
One of the most important predictive insights that a forecaster can provide is whether the current forecast can beat climatology
The forecast windows of opportunityapproach identifies windows in time and space when expected forecast skill is higher than usual because of the presence of certain phases of large-scale circulation patterns.
I often use a ‘poker’ analogy when explaining this to energy traders – you need to know whether to ‘hold’ or ‘fold’. In forecasting terms, this is the difference between a forecast with high or low confidence.
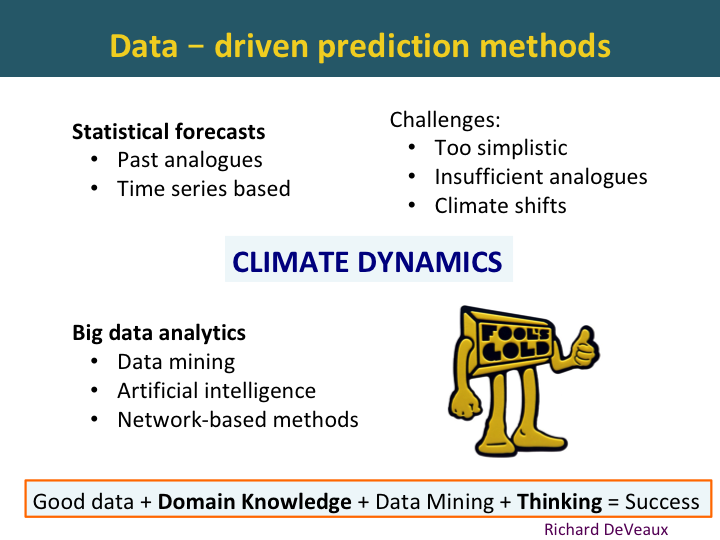
Data-driven prediction methods
Statistical forecasts have been used for many decades before global climate models were developed, notably for Asian monsoon rainfall. Traditional statistical forecasts have been time-series based or based on past analogues. While these methods do include insights from climate dynamics, they have proven to be too simplistic and there are an insufficient number of past analogues.
The biggest challenge for statistical forecasts is that they stop working when a regime shifts. You may recall in 1995 when Bill Gray’s statistical hurricane forecast model stopped working, when the Atlantic circulation pattern shifted. A more recent example is use of October snow cover in Siberia as a predictor of wintertime temperatures, this one also stopped working once the climate regime shifted.
Currently, big data analytics is all the rage for weather and climate prediction. IBM’s Watson is an example. Mathematicians and statisticians are applying data mining and artificial intelligence techniques to weather and climate prediction.
Artificial intelligence guru Richard DeVeaux provides the following recipe for success:
Good data + Domain Knowledge + Data Mining + Thinking= Success
The limiting ingredients are domain knowledge andthinking. Without a good knowledge of climate dynamics, fools gold will be the fruit of any climate forecasts based on data mining.
Seasonal to interannual predictions: predictive insights –> probabilistic forecasts
The way forward in pushing the time horizon further for meaningful probabilistic forecasts is to integrate global climate model forecasts with insights from data driven forecast methods.
The problem with climate model forecasts is that they invariably revert to climatology after a few months. The problem with data driven forecasts is that they lack space-time resolution.
These can be integrated by clustering the climate model ensemble members based on predictors from the data-driven forecasts.
Confidence assessment can be made based on the probability of regime shift.
Data-driven forecasts: climate dynamics analysis
In data-driven approaches to climate prediction, it is essential to understand the range of climate regimes that can influence your forecast. These regimes indicate memory in the climate system. The challenge is to identify the appropriate regimes, understand their impact on the target forecast variables, and to predict future shifts in these regimes.
CFAN’s analysis of climate dynamics includes consideration of these 5 time scales and their associated regimes, ranging from the annual cycle to multi-decadal time scales.
Circulation modes: sources of predictability
Our data mining efforts have identified a number of new circulation regimes that are useful as predictors over a range of time scales. These include:
- North Atlantic ARC pattern
- Indo-Pacific-Atlantic pattern
- Northern and southern hemispheric stratospheric vortex anomalies
- Bi Polar patterns in the stratosphere
- NAOX:North Atlantic SLP/wind pattern
- Global patterns of North –South winds in upper troposphere/lower stratosphere
North Atlantic ARC pattern
An intriguing development is underway in the Atlantic. This figure shows sea surface temperature anomalies in the Atlantic for May. You see an arc of cold blue temperature anomalies extending from the equatorial Atlantic, up the coast of Africa and then in an east-west band just south of Greenland and Iceland. This pattern is referred to as the Atlantic ARC pattern.
North Atlantic ARC SST anomalies
A time series of sea surface temperature anomalies in the ARC region since 1880 shows that changes occur in sharp shifts, you can see shifts occurring in 1902, 1926, 1971, and 1995
On the bottom graph, you see that the ARC temperatures show a precipitous drop over the past few months. Is this just a cool anomaly, similar to 2002? Or does this portend a shift to cool phase?
CFAN’s research has identified precursors to the shifts, we are actively assessing the current situation.
Atlantic AMO cool phase: impacts
A shift to the cool phase of the Atlantic Multidecadal Oscillation is expected to have profound impacts, based on past shifts:
- diminished Atlantic hurricane activity
- increased U.S. rainfall
- decreased rainfall over India and Sahel
- shift in north Atlantic fish stocks
- acceleration of sea level rise on NE U.S. coast
AMO impacts on Atlantic hurricanes
The Atlantic Multidecadal Oscillation has a substantial impact on Atlantic hurricanes. The top figure shows the time series of the number of Major Hurricanes since 1920. The warm phases of the AMO are shaded in yellow. You see substantially higher numbers of major hurricanes during the periods shaded in yellow
A similar effect of the AMO is seen on the Accumulated Cyclone Energy.
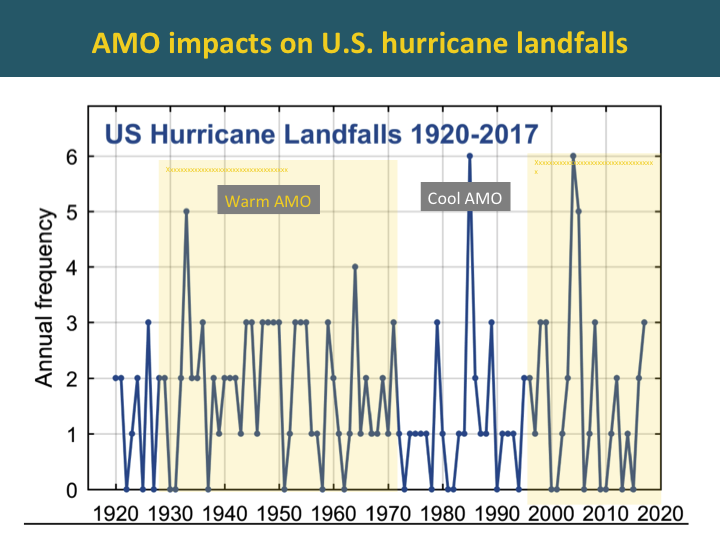
AMO impacts on U.S. landfalling hurricanes
By contrast, you see that the warm versus cool phases of the AMO has little impact on the frequency of U.S. landfalling hurricanes.
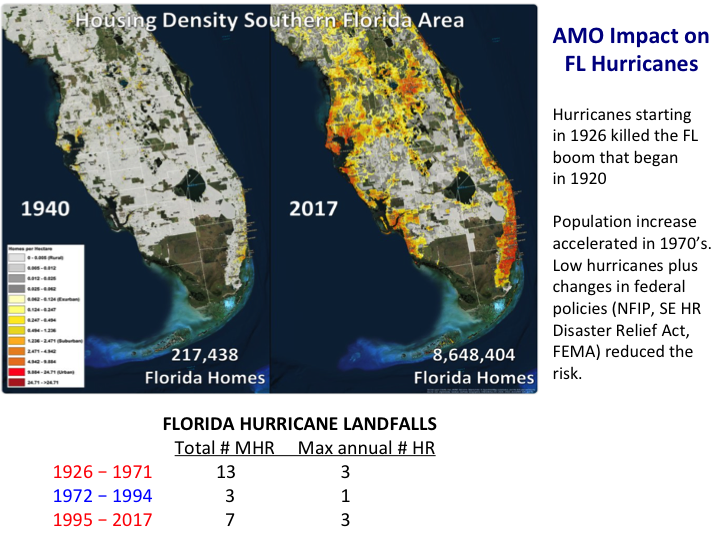
AMO impacts on FL hurricanes
However, the phase of the Atlantic Multidecadal Oscillation has a huge impact on Florida. During the previous cold phase, no season had more than 1 Florida landfall, while during the warm phase there have been multiple years with as many as three landfalls. A major hurricane striking florida is more than twice as likely during the warm phase relative to the cool phase.
These variations in Florida landfalls associated with changes in the AMO have had a substantial impact on development in Florida. The spate of hurricanes starting in 1926 0’ killed the economic boom that started in 1920. Population and development accelerated in the 1970’s, aided by a period of low hurricane activity.
CFAN’s seasonal forecasts of Atlantic hurricanes
CFAN’s approach examines global and regional interactions among ocean, tropospheric and stratospheric circulations. Precursor patterns are identified through data mining, interpreted in the context of climate dynamics analysis, and then subjected to statistical tests in hindcasts.
We consider three periods in our analysis, defined by current circulation regimes:
- The period since 1995, corresponding to the warm phase of the Atlantic Multidecadal Oscillation
- The period since 2002, defined by a 2001 shift in the North Pacific Ocean circulation patterns
- The period since 2008, characterized by a predominance of El Nino events, occurring every 3 years.
CFAN’s forecast for the 2018 atlantic hurricane season
Last week, we issued our third forecast for the 2018 Atlantic hurricane season. We are predicting below normal activity, with an ACE value of 63 and 4 hurricanes.
The figure on the right shows hindcast verification for our June forecast model for the # of hurricanes. The forecast is developed using historical data for 3 different periods, corresponding to the 3 regimes described earlier.
CFAN’s predictors for seasonal atlantic hurricane forecast
CFAN’s seasonal predictors are identified for each forecast using a data mining approach, with different predictors used for each lead time. The candidate predictors are then subjected to a climate dynamics analysis to verify that the predictors make sense from a mechanistic point of view.
The predictors that we use are predominantly related to atmospheric circulation patterns. Note, our predictors differ substantially from other groups providing statistical forecasts, who rely primarily on sea surface temperature and sea level pressure predictors.
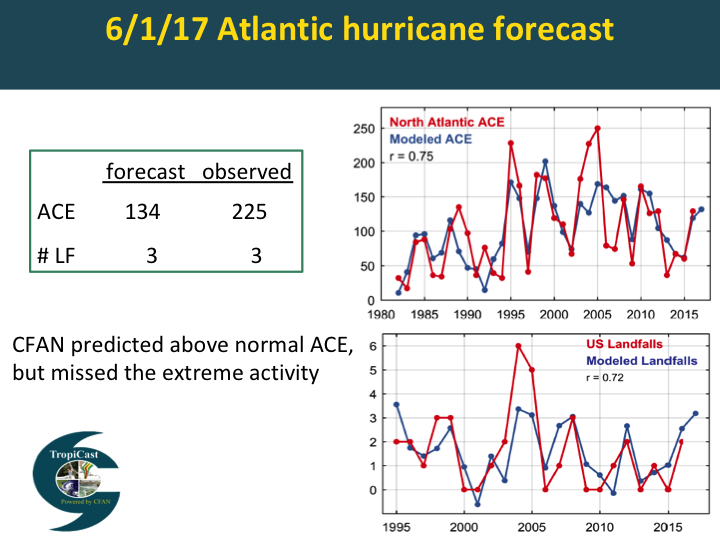
2017 seasonal forecast
Here is the forecast we made a year ago for the 2017 Atlantic hurricane season. We predicted an active season with 3 U.S. landfalls. We got the number of U.S. landfalls correct, but we substantially underestimated the Accumulated Cyclone Energy, or ACE.
From the perspective of the financial sector, the key issue is whether we will see another extremely active hurricane season and how that will translate into U.S. landfalls.
Atlantic hurricane forecast: worst case scenario
We conducted a data mining exercise to identify patterns that explained the extremely active seasons in 1995, 2004, 2005, 2017. Our current forecast model does capture the extremes in 1995 and 2017, but not 2004 and 2005.
The only predictor that popped up for 2004/2005 is a pattern in the stratosphere near Antarctica. At this point we have no idea whether this pattern could provide a plausible physically based predictor for Atlantic hurricane activity. The disturbing thing tho, is that polar stratosphere predictors predict an extremely active 2018 season in contrast to the other predictors we are using.
So at this point we don’t know weather we have unearthed a diamond or fools gold. In any event, this is a good example of both the promise and perils of data mining.