by Judith Curry
The final installment in the CE series on sea level rise.
1. Introduction
Global mean sea level (GMSL) has increased by about 8–9 inches since 1880, with about 3 inches occurring since 1993. As discussed in Part VI, scientists expect that GMSL will continue to rise well beyond the 21st century because of global warming that has already occurred and warming that is yet to occur.
The recent NOAA Report Global and Regional Sea Level Rise Scenarios for the United States has stated that even the relatively small increases in sea level over the last several decades have been associated greater storm impacts at many places along the U.S. coast. Further, the frequency of intermittent flooding associated with unusually high tides has increased rapidly in response to increases in local sea level, becoming a recurrent and disruptive problem.
Millions of people in the U.S. already live in areas at risk of coastal flooding, with more moving to the coasts every year. Rising seas will dramatically increase the vulnerability of this growing population, along with critical infrastructure related to transportation, energy, trade, military readiness, and coastal ecosystems and the supporting services they provide. It has been estimated in the NOAA report that 35 inches of sea level rise would permanently inundate areas currently home to 2 million Americans.
This essay addresses the U.S. coastal impacts of sea level rise. Apart from the issue of the extent to which global mean sea level rise can be attributed to human caused warming, this essay provides regional and local contexts for sea level rise against the broader context of global sea level rise. The analysis includes a focus on:
- Mississippi delta region
- Barrier islands
- Cities: San Francisco, New York, Miami
2. Perspective from the IPCC AR5
An overview of the impacts of global sea level rise on coastal regions is provided by the IPCC AR5 WGII Chapters 5 and 18. Chapter 18 includes an assessment of the challenges of attributing any of these impacts to human-caused global warming. Excerpts:
While it is likely that extreme sea levels have increased globally since the 1970s, mainly as a result of mean sea level rise due in part to anthropogenic warming, local sea level trends are also influenced by factors such as regional variability in ocean and atmospheric circulation, subsidence, isostatic adjustment, coastal erosion, and coastal modification. As a consequence, the detection of the impact of climate change in observed changes in relative sea level remains challenging. [AR5 WG II 18.3.3]
Anthropogenic causes of RSLR (regional sea level rise) include sediment consolidation from building loads, reduced sediment delivery to the coast, and extraction of subsurface resources such as gas, petroleum, and groundwater. Subsidence rates may also be sensitive to the rates of oil and gas removal. [T]he majority of the world’s largest deltas are currently subsiding at rates that are considerably larger than the current rates of sea level rise because of coastal sediment starvation due to substantial dam building over the 20th century or sediment compaction through natural or anthropogenic activities. Many large cities on deltas and coastal plains have subsided during the last 100 years: ~4.4 m in eastern Tokyo, ~3 m in the Po delta, ~2.6 m in Shanghai, and ~1.6 m in Bangkok. Loads from massive buildings and other large structures can also increase sediment compaction and subsidence. Regional sea level rise can exceed global mean sea level rise by an order of magnitude reaching more than 10 cm/yr. [AR5 WG II 5.3.2.2]
[T]here are multiple drivers involved in shoreline erosion that are unrelated to climate change including long shore sediment transport; the diversion of sediments by dams; and subsidence due to resource extraction, mining, and coastal engineering and development. Owing to the multiple natural and anthropogenic stressors contributing to coastal erosion, confidence in detection of a climate change contribution to observed shoreline changes is very low, with the exception of polar regions. [AR5 WG II 18.3.3]
Aquifers on the coasts of the USA have experienced increased levels of salinity largely due to excessive water extraction. Natural drivers combined with over-extraction, pollution, mining, and erosion compound groundwater supply problems. [AR5 WG II 5.4.2.5.1] Attribution of saline intrusion to incremental sea level rise is still not sufficiently supported. [AR5 WG II 5.4.2.5.1]
Coastal lagoons and estuaries, as well as deltas, are highly susceptible to alterations of sediment input and accumulation, processes that can be influenced by climate change via changes in mean and extreme sea levels, storminess, and precipitation. However, the primary drivers of widespread observed changes in those systems are human drivers other than climate change so that there is very low confidence in the detection of impacts related to climate change (Section 5.4.2). [AR5 WG II 18.3.3]
Summary. There is no question that local sea levels are increasing in some locations at rates that are causing damage in coastal regions. However attributing these changes to human caused global warming (even if you assume that recent global sea level rise is caused entirely by greenhouse gas emissions) is very challenging. This is because there are much larger impacts on local sea level rise from local geological processes, land use practices and coastal engineering.
3. Causes of regional sea level change
Sea levels have not been rising uniformly across the globe over the last century. The causes of regional sea level rise are summarized in the 2017 NOAA Report on Global and Regional Sea Level Rise Scenarios for the United States.
One reason for regional variations in rates of sea level rise is dynamic redistribution of ocean mass via ocean circulations. There are two regional patterns that impact U.S. coastlines. The Pacific Decadal Oscillation (PDO) has resulted in recent trends in the western Pacific that are much higher than the global rate (>10 mm/yr) to less than 1 mm/yr at several regions on the U.S. west coast.
Along the Northeast Atlantic coast, sea level trends have been higher than the global rate in recent decades. The relatively high rates have been attributed to changes in the Gulf Stream.
Vertical Land Motion (VLM) can be a significant factor in the overall rate of local/regional sea level rise (RSL) trends. The highest RSL rise trends are found in regions of Louisiana (8–10 mm/year), Texas (4–7 mm/year) and along the Northeast Atlantic from Virginia to New Jersey (3–5 mm/year) (NOAA). In these regions, glacial isostatic adjustment (GIA) and sediment compaction add about 0.5–2 mm/year to RSL change, and groundwater and oil/gas extraction processes further enhance RSL rise. Land subsidence rates of 2–5 mm/year or more are not uncommon for regions of the Northeast Atlantic and Gulf Coasts.
Glacial Isostatic Adjustment (GIA) is the ongoing response of the solid Earth to land-ice shrinkage since the end of the last ice age. Melting glaciers and ice sheets and changes in land-water storage not only change ocean mass and thus GMSL, but also produce regionally distinct signatures from changes in the Earth’s gravitational field and rotation, and lead to regional VLM.
The NOAA Report projects the following patterns of U.S. regional sea level (RSL) rise:
- Future (Regional Sea Level) RSL rise is amplified along the Northeast U.S. coast due to the effects of GIA, the far-field static equilibrium effects of Antarctic melt, and reduced transport of the Gulf Stream. Future RSL rise is partially reduced by intermediate-field static-equilibrium effects associated with relative proximity to Greenland and many northern glaciers.
- RSL rise is amplified along the western region of the Gulf of Mexico and much of the Northeast Atlantic coast by withdrawal of groundwater and/or fossil fuels.
- Future RSL is reduced along the Alaska and the U.S. Pacific Northwest coasts due to proximity to the Alaskan glaciers from both ongoing GIA to past glacier shrinkage and projected future losses.
- Under the higher future SLR scenarios, RSL is amplified along the continental U.S. Pacific Coast due to far-field static-equilibrium effects of Antarctic ice sheet melt.
The 2018 NOAA Report on Patterns and Projections of High Tide Flooding Along the U.S. Coastline addresses the issues surrounding high tide flooding. High tide flooding affects low-lying assets and infrastructure such as roads, harbors, beaches, private and commercial property, and public storm-, waste- and fresh-water systems.
High tide flooding occurs more often in certain seasons and during certain years. During an El Niño, high tide flood frequencies are amplified at about half of the U.S. coastal locations. Over the last several decades, annual frequencies of high tide flooding have been increasing along the Atlantic and Gulf coasts.
Projections from the NOAA Report find that by 2100, high tide flooding will occur ‘every other day’ (182 days/year) or more for
the Intermediate Low Scenario within the Northeast and Southeast Atlantic, the Eastern and Western Gulf. The Report concludes that the U.S. coastal cities are close to a tipping point with respect to flood frequency, as only 0.3 m to 0.7 m separates infrequent damaging-to-destructive flooding from a regime of high tide flooding—or minor floods from moderate and major floods.
4. Sea level rise ‘hot spots’
A recent article in the Conversation explains the issue: X-factor in coastal flooding: natural climate patterns create ‘hot spots’ of rapid sea level rise. The article is written by authors of the recent publication Spatial and temporal variability of sea level rise hot spots over the eastern United States. Excerpts from the article:
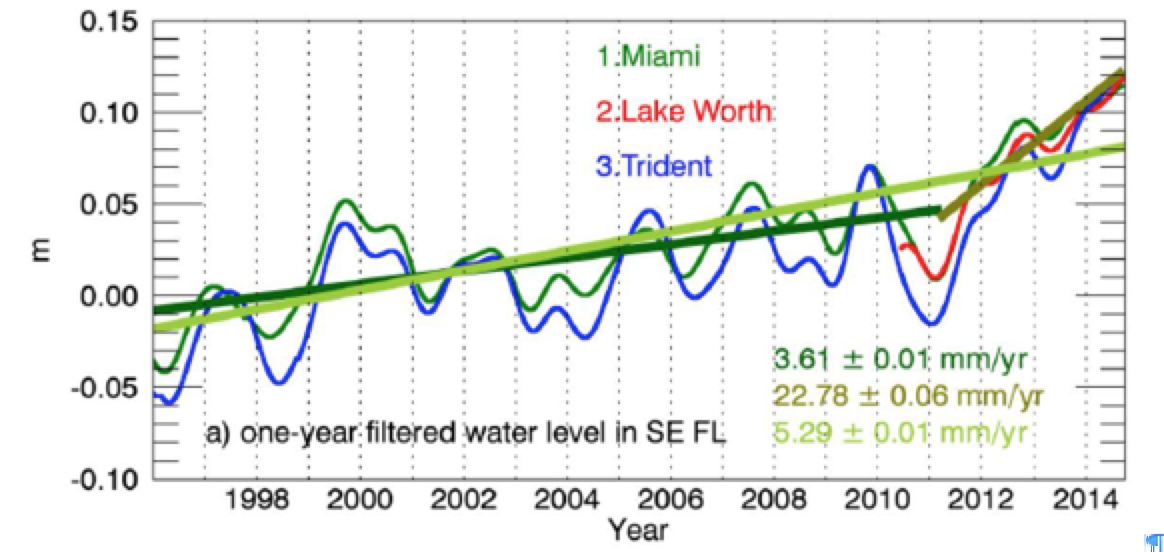
[We] found that sea level rise had accelerated rapidly at nearby Trident Pier [Florida] between 2011 and 2015. While global sea level has been rising at an average pace of about 1 foot per century, this site had recorded an increase of about 5 inches in a mere five years.
These rates were ten times higher than the long-term rates of sea level rise along the Florida coastline. Further investigation showed that all tide gauges south of Cape Hatteras showed a similar uptick over the same period. Such hot spots have occurred at other points along the Eastern Seaboard over the past century. Now we see indications that one is developing in Texas and Louisiana.
A recent paper by McCarthy et al. proposed that the North Atlantic Oscillation (NAO), a seesaw pattern in air pressure over different regions of the North Atlantic Ocean, could explain the shift in the position of short-term variations in sea level rise. Shifts in the NAO alter the position of the jet stream, wind patterns and storm tracks, all of which affect the distribution of water in the North Atlantic basin. Ultimately, the cumulative effects of NAO on the ocean determine whether water will pile up to the north or south of Cape Hatteras. Thus, water piled up preferentially to the north of Cape Hatteras in the period 2009-2010, and to the south from 2011 to 2015.
This NAO-related mechanism explained where sea level accelerations might occur along the Atlantic coast, but did not seem to explain their timing. We [found] that the timing of short-term sea level accelerations, lasting one to several years, was correlated with ENSO.
Although ENSO occurs in the Pacific, its effects propagate across North America, altering air temperatures and wind regimes in the eastern United States. These changes in wind distributions can affect water transport in the North Atlantic Ocean, causing it to build up along the U.S. Eastern Seaboard at times.
We found that short-term accelerations in sea level rise have repeatedly occurred over the last century, sometimes occurring south of Cape Hatteras and sometimes focused north of the Cape. These hot spots can exceed rates of 4 inches in five years, and can occur anywhere along the U.S. Atlantic coast. They form when the accumulated signals of ENSO and the NAO converge, displacing seawater toward the coastline.
5. Barrier islands and deltas
The most vulnerable regions to sea level rise are the barrier islands along the U.S. coast and the Mississippi Delta.
5.1 Mississippi delta
As per the Wikipedia :
The Mississippi River Delta region is a 3-million-acre (12,000 km2) area of land that is part of the Louisiana coastal plain, one of the largest areas of coastal wetlands in the United States.The Mississippi River Delta containing more than 4000 square miles of coastal wetlands and 37% of the estuarine marsh in the conterminous U.S. The coastal area is the nation’s largest drainage basin and drains about 41% of the contiguous United States into the Gulf of Mexico.
A new paper by Chamberlain et al. (2018) provides an anatomy of the dynamics of the Mississippi delta. Deltas can undergo rapid transformations due to reductions in sediment supply, accelerating rates of sea-level rise, plus high subsidence rates. The Mississippi delta is undergoing all three processes. Preindustrial conditions produced 6 to 8 km of new land per year. However, these rates are several times lower than rates of land loss over the past century. Recent land loss rates (~45 km2/year) in combination with the global sea-level rise acceleration, net land loss in the Mississippi delta will likely continue regardless of coastal restoration strategies.
A recent paper by Maloney et al (2018) finds that the Mississipi River delta is entering a period of retrogradation owing to the decline in the incoming sediment. Since the 1950s, the suspended sediment load of the Mississippi River has decreased by ~50% due primarily to the construction of >50,000 dams in the Mississippi basin. They found that the Mississippi River delta front has entered a phase of retrogradation, which occurs when the mass balance of sediment into the delta is such that the volume of incoming sediment is less than the volume of the delta that is lost through subsidence, sea level rise and/or erosion.
A new subsidence map of coastal Louisiana developed by researchers at Tulane University finds the region to be sinking at just over one third of an inch per year (or 9 mm/yr) [compare this value with the average rate of global sea level rise of 3 mm/yr]. The average elevation of New Orleans is currently between 1-2 feet below sea level, with elevations ranging from 20 feet above sea level to 7 feet below sea level.
It may seem that fighting to save the Mississippi delta region is a losing battle. However a recent WaPo article describes how the Louisiana Coastal Protection and Restoration Authority, using funds from the British Petroleum oil spill settlement, is moving forward with two large sediment “diversions.” These diversions will start channeling huge volumes of river water in new directions, in a bid to protect areas around New Orleans in particular.
Summary. The issue of sea level rise and land loss in the Mississippi delta region is complex, with geological subsidence and the decline in sediment transported by the Mississippi river being the dominant drivers. For a city whose elevation averages one to two feet below sea level, sea level rise from human caused warming does not seem to be the dominant driver for the problems that the region is facing.
5.2 Barrier islands
Barrier islands are a type of dune system that form by wave and tidal action parallel to the mainland coast. They are subject to change particularly during storms, but protect the coastlines from storms and create areas of protected waters for wetlands. The morphology of barrier islands is determined by tides, wave energy, sediment supply, sea level trends and the seabed morphology. The amount of vegetation on the barrier island has a large impact on the height and evolution of the island. Barrier islands are prominent on the U.S. East Coast and Gulf Coast; no barrier islands are found on the U.S. Pacific coast due to the rocky shore and short continental shelf.
The barrier islands are beautiful and provide homes to many important ecosystems. Some of the islands have undergone a great deal of development for tourism and residential communities.
Louisiana has 8 barrier islands. Much ado has been made about the ‘climate refugees’ from Isle de Jean Charles, which is disappearing – in 1955, there were 22,000 acres while there are 320 acres today [link]. The principal problem traces back to the Great Mississippi Flood of 1927 when the corps of engineers responded by building giant levees to constrain the river, which stopped the flow of sediment into its delta. It appears that these refugees should more accurately be referred to as ‘Mississippi flood mitigation refugees.’
The Wikipedia lists 45 barrier islands in Florida, which make up more than 700 miles of Florida’s coastline. The Florida barrier islands have gorgeous white sand beaches and are popular tourist destinations. Many have vibrant, wealthy residential communities.
Studies are underway to develop proposals to raise roads on Key Largo and Miami Beach [link]. Drainage solutions common in other areas won’t work on the Florida Keys, since there is porous limestone rock underneath the soil. When water levels get high, porous rock is filled with groundwater and can crack asphalt. High groundwater also means pumps are needed to send the water elsewhere, as Miami Beach does. Miami Beach has become a laboratory for sea level rise mitigation efforts. However, residents in Miami Beach are pushing back against plans to raise streets, since the fear this will bring flooding into homes.[link]
There is also concern about Georgia’s barrier islands. Georgia’s costal islands are constantly changing from the natural directions of the currents. If these barrier islands continue to erode with rising sea levels, Georgia’s mainland coast will become more susceptible to erosion and to powerful coastal storms. But it’s not all bad news. Irma’s winds carved a new island off the Georgia coast [link]. The 100-acre island broke away from Blackbeard Island, which is near Sapelo, about 60 miles south of Savannah. This piece of land had been slowly separating from Blackbeard Island for decades, and was barely connected before the hurricane.
Summary. The morphology of barrier islands is very dynamic. Storms and engineering practices that influence the natural flow of sediment have a substantial influence on this morphology, independent of sea level rise (of course, sea level rise is not helping). Particularly for the barrier islands that have developed wealthy communities, aggressive engineering strategies are being developed. These most vulnerable islands are becoming laboratories for coastal sea level rise adaptation strategies. But it is probably futile to expect these changeable islands to remain as geologically stable entities for a very long times.
6. Coastal cities
Nearly all of the cities along the U.S. coast are concerned about sea level rise. This section focuses on two of the largest coastal cities facing sea level rise problems:
- Miami
- New York City
- San Francisco
6.1 Miami and south Florida
Miami has a population of more than 5.5 million living at an elevation of 6 feet above sea level.
The impact of the ‘hot spot’ on Miami is described in an article at gizmodo. Around 2011, the slow upward creep of the ocean seemed to kick into high gear, with tidal gauges recording much faster rates of sea level rise and residents noting a stark uptick in so-called “nuisance” floods. A new study confirms that this was not Floridians’ imaginations: From 2011 to at least 2015, the rate of sea level rise across the southeastern US shot up by a factor of six, from 3-4 millimeters a year to 20.
From a recent BBC article about Miami’s sea level rise:
For both Fort Lauderdale and other communities across south Florida, the main problem is drainage. The systems here were designed to let stormwater drain into the ocean when it rains. Because homes and gardens are higher than the crown of the road, the streets flood first in a storm, by design. Water runs into the storm drain and is piped into the ocean or waterways that lead there. At least, that’s what is supposed to happen. With sea levels now often higher than the exits to the run-off pipes, saltwater is instead running up through the system and into the streets. To make matters worse, when the sea gets even higher, it can breach the seawall, flood people’s yards and flow down to the road – where it stays.
“Nobody’s doing better adaptation work in the country than south Florida,” says Daniel Kreeger, executive director of the nonprofit Association of Climate Change Officers. But the question isn’t whether this work will save every community: it won’t. Even those tasked with making their cities resilient admit that, at some point in the future, certain areas here will no longer be “viable” places to live. Rather, the challenge is to do enough to ensure that the economy as a whole continues to thrive and that tourists still come to enjoy the sun, sand – and swelling sea.
Well, what is the near-term bottom line for Miami regarding sea level rise? A recent NPR article sums it up: South Florida Real Estate Boom Not Dampened by Sea Level Rise.
6.2 New York City
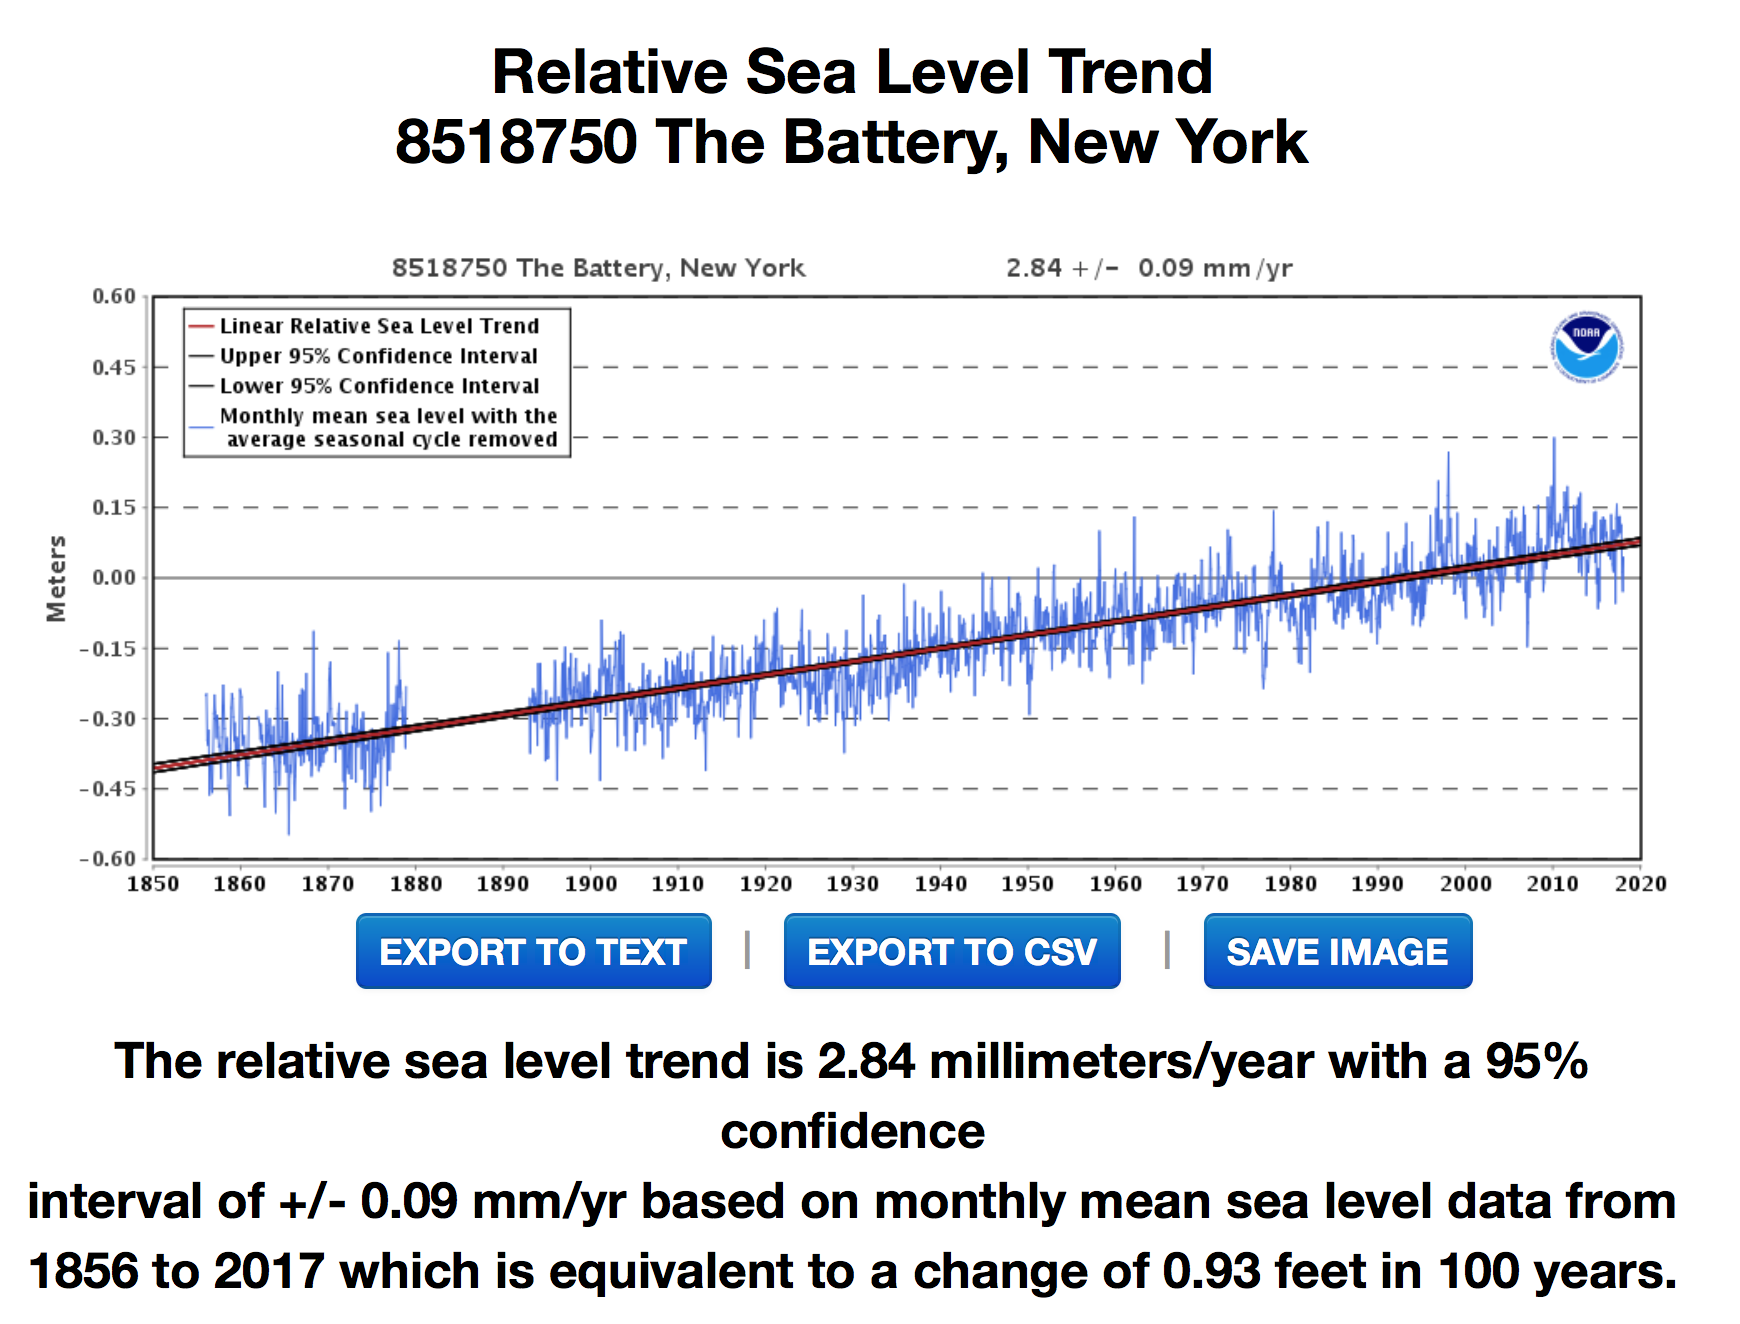
In New York City, sea level has risen 11 inches over the past century, which is a greater rate than mean global sea level rise. It has been estimated [link]
that land subsidence [sinking] in the New York City area has been roughly 3-4 inches per century.
New York City is particularly vulnerable to the effects of sea level rise because it is built primarily on islands and has 520 miles of coastline [link]. The City’s waterfront is among its greatest assets. Wealthy New Yorkers have a predilection for living along the waterfront in Manhattan, Brooklyn and Queens. There is also substantial infrastructure and municipal facilities along the coast, including roads, bridges, parks, waste transfer stations and wastewater treatment plants, that are at risk from sea level rise.
New York City has been proactive in tackling climate change risks and sea level rise, even before Hurricane Sandy in 2012 [link]. Following Hurricane Sandy, a comprehensive plan has been developed: City of New York: Building a Stronger, More Resilient New York.
6.3 San Francisco
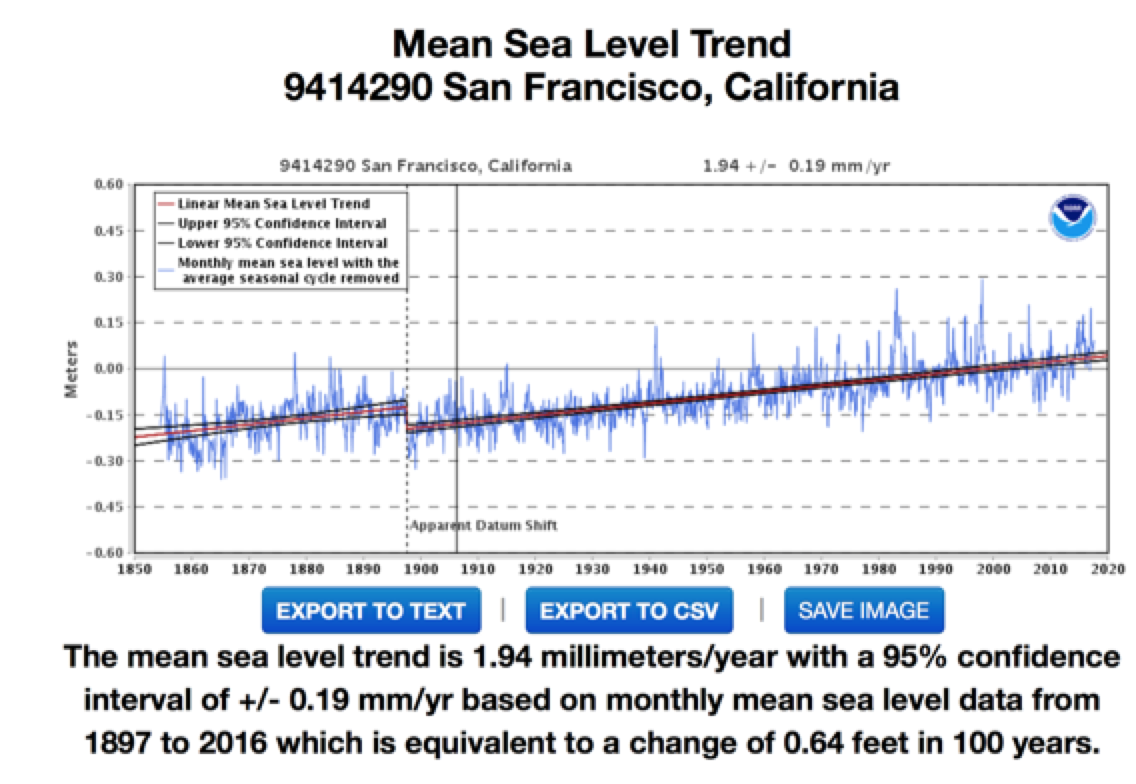
Sea level has been measured in the San Francisco Bay area since the 19th century. Over the past the past 100 years, sea level has risen by 7.7 inches, which is slightly lower then the global average rate.
The Bay area’s problem with sea level rise is summed up by the title of this article: Rising Seas are Quickly Sinking Bay Area Landfill Zones,
which is based on a publication by Mirzaei and Burgmann. From the article:
Landfill zones are sinking due to soil compaction, and at a rather alarming rate. “We found that they’re sinking as much as one-half inch (12.7 millimeters) annually,” says Bürgmann. “Sea level rise, by contrast, is on the order of one to three millimeters per year.” The new maps identify 48 to 166 square miles as prone to inundation. Half of San Francisco International Airport’s runways could be underwater by the turn of the century.
Landfill compaction isn’t the only cause of land subsidence in the Bay Area. River and stream outflows into the bay deposit a lot of silt and mud and these areas also are subsiding as they become compacted and dry out. Another major contributor to land subsidence is groundwater pumping.
7. Reconciling historical and future projected sea level rise accelerations
Watson (2016) published an analysis of the sea level rise data for the U.S., using Singular Spectrum Analysis (SSA). The analytical package used by Watson is designed to enhance estimates of trend, real-time velocity and acceleration in the relative mean sea-level signal derived from long annual average ocean-water-level time series. Key findings from the study:
- At the 95% confidence level, no consistent or substantial evidence (yet) exists that recent rates of rise are higher or abnormal in the context of the historical records available for the United States.
- It is likely that a further 20 years of data will identify whether recent increases east of Galveston and along the east coast are evidence of the onset of climate change induced acceleration.
The magnitudes of observed rates of sea level rise and accelerations are relatively small compared to those associated with predicted scenarios of 21st century sea level rise (e.g. IPCC, NOAA). Under various forecast scenarios, the current rate of global averaged sea-level rise of ~3 mm/yr is expected to increase to rates of the order of 10–20 mm/yr or more by 2100.
Figure 7 from Watson (2016) provides a visual analysis of how the velocity and acceleration time series might change at San Francisco and New York based on a mean sea-level rise of 80 cm from present (2014) to 2100. This analysis provides a sense of perspective regarding the changes of mean sea level at these locations to give effect to meet these projections.
8. Conclusions
The implications of sea-level rise, particularly the much larger projected rates of rise under future climate change scenarios (e.g IPCC, NOAA) are profound, with far reaching socioeconomic and environmental implications.
The Mississippi delta and many barrier islands will undoubtedly undergo marked changes in the future, with or without global warming. Land use and engineering in the major coastal cities have brought on many of the worst problems, notably landfilling in coastal wetland areas.
The most vulnerable locations are developing comprehensive adaptation plans, notably Florida and New York City. There are no easy solutions and no obvious scapegoats to blame, in spite of the numerous sea level rise related global warming lawsuits (see previous blog post The blame game).
But the bottom line remains that in many of the most vulnerable locations, natural oceanic and geologic processes and land use practices are the dominant causes of local sea level rise problems. Sea level will continue to rise in the 21st century. The more extreme scenarios of 21st century sea level rise from human caused global warming would dominate local sea level rise pretty much everywhere, but the smaller values such as the likely range from IPCC RCP4.5 scenario would not dominate local sea level rise in many locations.
What surprises me is that there seems to have been so little general awareness of the sea level rise issue until several decades ago. Mean global sea level has risen at a slow creep for about 150 years. The cumulative impact of local land use impacts is driving awareness in the most vulnerable locations, even though the popular discourse tends to blame these problems on human caused global warming.
In terms of adaptation strategies in the face of uncertainty in 21st century sea level rise projections, the issue becomes how much resilience can you afford? Wealthy places like Miami Beach will pull out all the stops to adapt to this. Large cities with major infrastructure on vulnerable coasts (e.g. the San Francisco airport) will need to consider the sea level rise in their next generation infrastructure plans. Other locations (e.g. deltas, barrier islands) will need to acknowledge that unavoidable changes are coming.