by Judith Curry
A new paper purports to have resolved the discrepancy between climate response estimates from global climate models versus energy budget models.
Reconciled climate response estimates from climate models and the energy budget of Earth
Mark Richardson, Kevin Cowtan, Ed Hawkins & Martin B. Stolpe
Abstract. Climate risks increase with mean global temperature1, so knowledge about the amount of future global warming should better inform risk assessments for policymakers. Expected near-term warming is encapsulated by the transient climate response (TCR), formally defined as the warming following 70 years of 1% per year increases in atmospheric CO2 concentration, by which point atmospheric CO2 has doubled. Studies based on Earth’s historical energy budget have typically estimated lower values of TCR than climate models, suggesting that some models could overestimate future warming2. However, energy-budget estimates rely on historical temperature records that are geographically incomplete and blend air temperatures over land and sea ice with water temperatures over open oceans. We show that there is no evidence that climate models overestimate TCR when their output is processed in the same way as the HadCRUT4 observation-based temperature record. Models suggest that air-temperature warming is 24% greater than observed by HadCRUT4 over 1861–2009 because slower-warming regions are preferentially sampled and water warms less than air5. Correcting for these biases and accounting for wider uncertainties in radiative forcing based on recent evidence, we infer an observation-based best estimate for TCR of 1.66 °C, with a 5–95% range of 1.0–3.3 °C, consistent with the climate models considered in the IPCC 5th Assessment Report.
Published in Nature Climate Change [link to abstract]
The paper is behind paywall, but Ed Hawkins has a blog post with more extended discussion Reconciling estimates of climate sensitivity, including discussion of the figures (with full captions). Excerpts:
Climate sensitivity characterises the response of the climate to changes in radiative forcing and can be measured in many different ways. However, estimates derived from observations of historical global temperatures have tended to be lower than those suggested by state-of-the-art climate simulators. Are the models too sensitive?
A new study largely explains the difference – it is because the comparison has not been done ‘like-with-like’.
An earlier study by Cowtan et al. demonstrated that these subtle differences in producing estimates of global temperature can make a significant difference to conclusions drawn from comparisons of observations and simulations. When using simulated air temperatures everywhere, the models tend to show more warming than the observations. However, when the comparison is performed fairly, this difference disappears. Roughly half of the difference is due to masking and half due to blending. The size of the effect is not trivial. According to the CMIP5 simulations, more than 0.2°C of global air temperature change has been ‘hidden’ due to our incomplete observations and use of historical sea surface temperatures.
But what effect does this have on estimates of climate sensitivity? A new study, led by Mark Richardson, repeated the analysis of Otto et al. but used updated observations, improved uncertainty estimates of aerosol radiative forcing and, critically, considered the blending and masking effects described above.
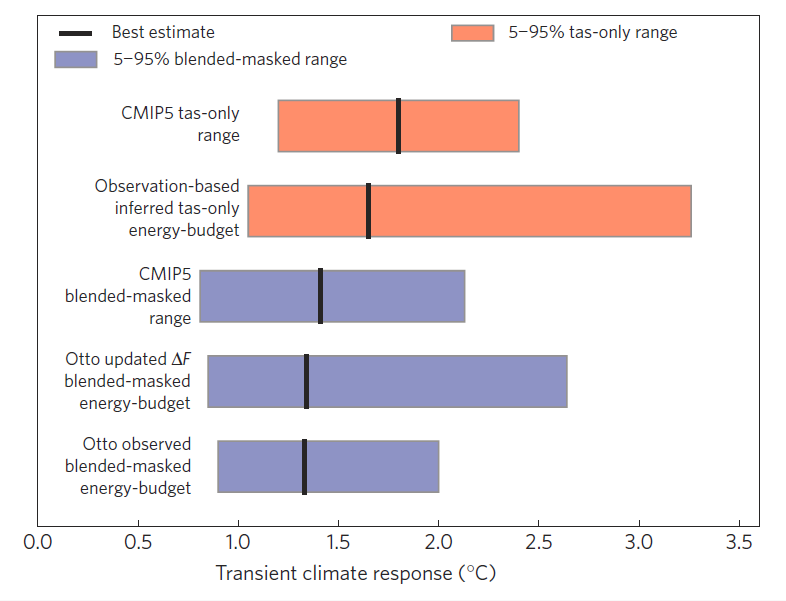
So, according to the CMIP5 simulations, the TCR estimated from our available observations will always be lower than if we had full spatial coverage of global near-surface air temperature. To summarise the effect of the differences in analysis methodology, Figure 3 shows various estimates of TCR. The top red bar shows the raw estimates of TCR from the CMIP5 simulations and the bottom blue bar is the original result from Otto et al. based on observations. The various bars inbetween reconcile the difference between Otto et al. and CMIP5.
Figure 3: Comparison of modelled and observed TCR estimated from Earth’s historical energy budget. The blue bars show blended-masked results, reported upwards as Otto et al.’s results using HadCRUT4 observations, the same results using updated aerosol forcing (from Lewis & Curry), and the range when the same calculation is applied to blended-masked CMIP5 temperature series (one simulation per model). The red bars compare our bias-corrected estimates of tas-only TCR from HadCRUT4 using the Otto calculation with Lewis and Curry forcings, and the canonical CMIP5 model range. The updated observation-based estimate is higher due to the corrected blending-masking bias, and has a wider range due to the greater uncertainty in radiative forcing series used. Boxes represents 5–95% range and thick vertical lines are the best estimate.
For example, if the models are treated in the same way as the observations, then the estimated TCR is the top blue bar, in much better agreement with Otto et al. There is then no discrepancy between the observation and simulation estimates of TCR when they are treated the same way. (The second blue bar shows the impact of updating the uncertainty estimates of aerosol radiative forcing on the Otto et al result, which is a separate issue.)
However, we can also reverse the procedure above and estimate by how much we need to scale the TCR estimated from the observations to reproduce what would be derived if we had air temperatures everywhere. This is the second red bar in Figure 3, which overlaps the CMIP5 simulation range and has a best estimate of 1.7K (range, 1.0-3.3K)
JC NOTE: For reference, see Nic Lewis’ latest values [link]:
Richardson et al conclude that previous analyses which reported observation-based estimates of TCR toward the low end of the model range did so largely because of inconsistencies between the temperature reconstruction methods in models and observations.
Finally, if the reported air-ocean warming and masking differences are robust, then which global mean temperature is relevant for informing policy? As observed? Or what those observations imply for ‘true’ global near-surface air temperature change? If it is decided that climate targets refer to the latter, then the warming is actually 24% (9-40%) larger than reported by HadCRUT4. And that is a big difference, especially when considering lower global temperature targets.
JC reflections
The key issue that this paper raises is about the quality of the global surface temperature data sets, particularly related to sampling. The paper infers that the trend of surface temperature anomalies in HadCRUT4 are 9-40% lower than the true global averages. Is this believable? Well the uncertainty in surface temperature trends (9-40%) doesn’t seem implausible, but the inference that the uncertainty is only on the side of insufficient warming doesn’t seem plausible. There are many uncertainties in these global surface temperature data sets, although sampling is probably the largest uncertainty. Where does the (9-40%) numbers come from? Climate models.
If you want to sort out the sampling uncertainty of a dataset like HADCRUT4, the best way to approach this is compare with the global reanalysis datasets like ECMWF and the NCEP reanalysis (both of which disagree significantly with each other). By subsampling the ECMWF and NCEP reanalyses, and then comparing with the global reanalyses, you could get a handle on the biases in HadCRUT4 from under sampling (and the uncertainty in this bias). This is a much better approach than trying to infer the bias in a trend using global climate models that are biased warm.
Ed Hawkins asks the question: Finally, if the reported air-ocean warming and masking differences are robust, then which global mean temperature is relevant for informing policy? Here is my answer:
- As a stand alone dataset to document global warming, then a data set like HADCRUT4 is the best, which reflects the actual data that is available.
- For climate sensitivity analyses, you need a global data set. I am not a fan of any of the statistical infilling methods used in the data sets (although local infilling by Berkeley Earth is probably the best of the methods). I think the best path forward is the ‘dynamic’ infilling approach used in the data assimilation of numerical weather prediction models (the reanalyses). Coupled reanalyses (atmosphere-ocean) are the way to go, but these are in their infancy (I think I have a draft post on this topic buried in my files).
- In the absence of a truly global data set with ‘dynamic’ infilling, then the uncertainty analysis is of paramount importance. I realize that the HadCRU and NOAA groups are doing an increasingly thorough job of analyzing the uncertainty, but it does not yet comprehensively address all of the areas of uncertainty.
So the apples that I want to see is a truly global surface air temperature dataset derived from several different global coupled reanalyses.
In any event, I agree with Cowtan’s point that in comparing model and observation trends, you should subsample the model simulations to match the observations.
So, how should we approach estimates of climate sensitivity using the observations we have today? I think the best approach is to fully account for the uncertainties in the global surface temperature data sets in the analysis. This could be accomplished in several ways.
Lets get back to the Richardson analysis. What insights are provided by their sensitivity analysis?
The first major challenge is that the forcings (and forcing change over the period) used in the CMIP5 models don’t match the best observationally-based forcing estimates that emerged from the AR5. And if you are subsampling the CMIP5 models and using global forcing data, that introduces at least a different species of apple into this since several forcings are not homogeneous over the globe (aerosols, volcanic forcing, solar).
Here is why I think it might be better to use HADCRUT4 than a truly global data set for doing climate sensitivity analysis. The main thing missing in the HADCRUT4 analysis is the Arctic region. And the Arctic is hugely sensitive to the multi-decadal ocean oscillations, which was noted in the AR5:
“Arctic temperature anomalies in the 1930s were apparently as large as those in the 1990s and 2000s. There is still considerable discussion of the ultimate causes of the warm anomalies in the 1920s and 1930s.” (IPCC AR5)
“A recent multi-proxy 2000-year Arctic temperature reconstruction shows that temperatures during the first centuries were comparable or even higher than during the 20th century.”
Assuming that these high amplitude variations in the Arctic have a substantial component from natural internal variability, this variation should not be included when you are trying to infer the externally forced variability from CO2. How much of the current warming and sea ice loss in the Arctic is natural versus forced by CO2 remains highly uncertain, the AR5 makes a very conservative statement:
“Anthropogenic influences have very likely contributed to Arctic sea ice loss since 1979.”
‘Contributed’ – apparently the AR5 did not have sufficient confidence to say anything like ‘more than half’.
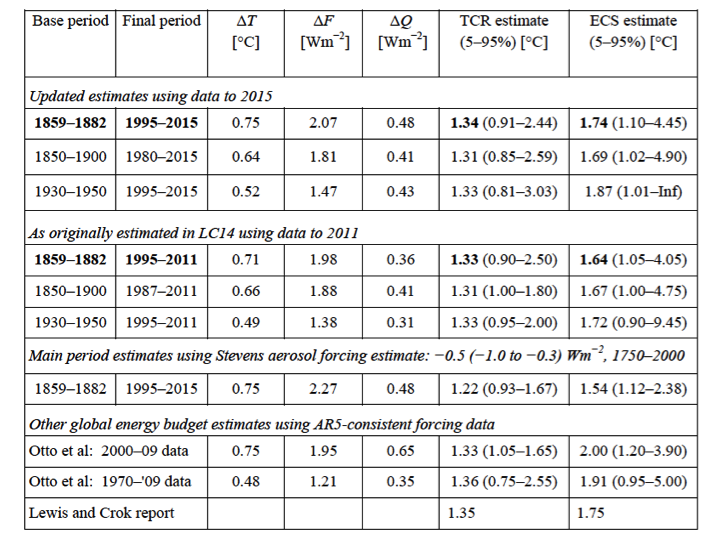
Lewis and Curry (2014) attempted to factor out some of the multi-decadal variability in calculations of ECS by choosing two periods with approximately the same AMO index (and an absence of major volcanic eruptions). Even so, the LC14 analyses implicitly assumed that the warming during 1910-1945 was ‘forced’, and based on climate model simulations, it appears that only a fraction of this warming was forced. So until we are able to separate out multi-decadal internal variability from forced variability, we will be overestimating climate sensitivity using the energy balance methods.
So, have Richardson et al. presented a convincing argument that the models and observational estimates of TCR are in agreement?
Well, the biggest outstanding issue is that of aerosol forcing; if you use Bjorn Stevens’ aerosol forcing values, Nic Lewis (from table above) finds the (0-95%) range to be 0.93 – 1.67 C, whose upper limit is below the mean of Richardson’s subsampled CMIP5 sensitivities. Yes the values do overlap, but this is a far cry from ‘agreement’.
Where does this leave us? Well we can infer from this that including the Arctic in climate sensitivity analyses makes a fairly large difference; however some (if not most) of the Arctic warming has been from natural internal variability, which shouldn’t be counted in the climate sensitivity estimates.
So the road forward on this requires efforts in (at least) two directions:
- Truly global surface air temperature datasets using ‘dynamic’ infilling in the context of coupled global reanalyses
- Separating out natural internal variability from forced variability in the observational estimates of climate sensitivity
Filed under: Sensitivity & feedbacks