by Judith Curry
I am preparing a new Special Report on Hurricanes and Climate Change.
This Report is easier than my Special Report on Sea Level and Climate Change. Sea level and glaciers are very fast moving topics, whereas for hurricanes, the big picture conclusions haven’t really changed in a decade.
The Table of Contents for the Report: [ HR outline ]
The topic of tropical cyclones and climate change is regularly assessed by the IPCC and US National Assessment Reports, as well as by other expert reports under the auspices of the WMO, CLIVAR and other organizations. With regards to the question: ‘Why another assessment report on Hurricanes and Climate Change?’ here is my response:
CFAN’s Special Report on Hurricanes and Climate Change is distinguished from recent assessments by the following:
- a focus on hurricane aspects that contribute to landfall impacts
- an emphasis on geologic evidence and interpretation of natural variability
- an approach to ‘detection and attribution’ that does not rely on global climate models
- a perspective on future projections that accounts for uncertainties in climate models and also includes natural climate variability
- a longer format that allows for more in depth explanation suitable for a non-expert audience.
Basically, this Report is motivated by the needs of my clients in the energy and insurance sectors. After grappling with this issue for the past 15 years, both from the perspective of a research scientist and the owner of a weather/climate services company (Climate Forecast Applications Network), I have a perspective that is somewhat different from other academic or government scientists addressing the problem of hurricanes and climate change.
I plan to make the full report available in May, I look forward to your feedback and suggestions.
In this post, I’ll start with Chapter 3 on the observational datasets of hurricane variability and trends. An additional 4 posts on this topic will provided in the coming weeks.
Historical variability and trends
Documenting the variability and trends of hurricane activity requires long and accurate data records. Historical information on hurricane activity is obtained from the following sources:
- satellite observations (since ~1966)
- aircraft instrumental observations (since 1944)
- surface-based instrumental observations – landfalls, ships (since the 1800’s)
- historical reports
Over the years, the way that hurricanes have been observed has changed radically. As a result, many hurricanes are now recorded that would have been missed in the past. Furthermore, satellites are now able to continually assess wind speeds, thus recording peak wind speeds that may have been missed in pre-satellite days. Unfortunately, temporally inconsistent and potentially unreliable global historical data hinder detection of trends in tropical cyclone activity.
This Chapter assesses the variability of global and regional hurricanes over the entire available database. An assessment is provided as to whether we can detect any global or regional trends in hurricane activity from the available data.
3.1 Global
Reliable global hurricane data from satellite has been available since 1970, although inference of hurricane intensity is not judged to be reliable prior to 1980 (and in some regions, prior to 1988). Hurricane intensity is estimated from visible and infrared satellite observations through cloud patterns and infrared cloud top temperatures.
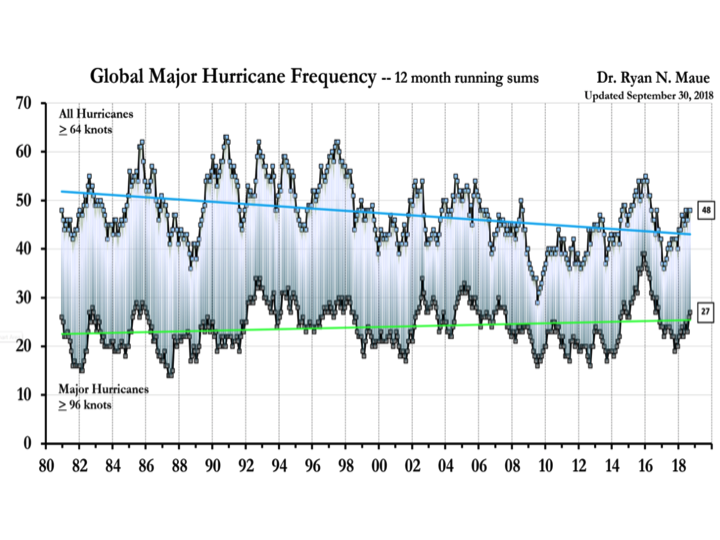
Figure 3.1 shows the time series since 1981 of total global hurricanes and major hurricanes. On average, each year there are about 47 hurricanes with about 20 reaching major hurricane status. Substantial year-to-year variability is seen, with a slight decreasing trend in the number of hurricanes and a slight increasing trend in the number of major hurricanes.
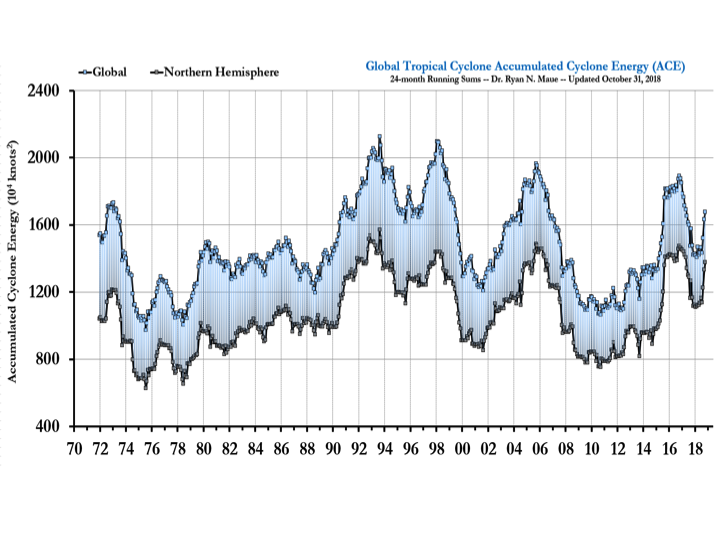
Figure 3.2 shows the time series since 1971 of the global Accumulated Cyclone Energy (ACE) (see Chapter 2 for a definition of ACE). As an integral of global hurricane frequency, duration and intensity, ACE shows greater decadal variation than does the number of hurricanes in Figure 3.1. No trend in ACE is seen, and the recent period of 2009 to 20015 was characterized by particularly low values of ACE.
Figure 3.1: Global Hurricane Frequency (all & major) since 1981 – 12-month running means. The top time series is the number of global tropical cyclones that reached at least hurricane-force (maximum lifetime wind speed exceeds 64-knots). The bottom time series is the number of global tropical cyclones that reached major hurricane strength. Source: Maue (2018).Figure 3.2: Global and Northern Hemisphere Accumulated Cyclone Energy: 24 month running means. Note that the year indicated represents the value of ACE through the previous 24-months for the Northern Hemisphere (bottom line/gray boxes) and the entire global (top line/blue boxes). The area in between represents the Southern Hemisphere total ACE.
Source: Maue (2018)
3.1.1 Intensity
Figure 3.1 indicates that the number of major hurricanes is increasing globally, whereas the total number of hurricanes is decreasing. An increase in hurricane intensity has long been hypothesized to occur as global sea surface temperatures increase.
Emanuel (2005) identified a trend since 1950 of increasing maximum hurricane Power Dissipation Index (PDI), focusing on hurricanes in the North Atlantic and North Pacific. Shortly thereafter, Webster et al. (2005) showed that while the total number of hurricanes has not increased globally since 1970, the proportion (%) of Category 4 and 5 hurricanes had doubled, implying that the distribution of hurricane intensity has shifted towards more intense hurricanes.
Klotzbach and Landsea (2015) updated the Webster et al. (2005) analysis (Figure 3.3), with an additional 10 years of data and the availability of the International Best Tracks (IBTrACS) dataset, which reflects a cleaning up and homogenization of the data relative to what was used by Webster et al. Interpretation of any increase in the % of Cat 4/5 hurricanes depends on interpretation of the data quality, which Klotzbach and Landsea argue is an issue prior to 1988. Klotzbach and Landsea make a convincing argument that data prior to 1980 should not be used in trend analyses. The debate on the increase in % CAT4/5 hurricanes hinges on whether the data from 1985-1989 is of useful accuracy, since the large jump occurs between 1985-1989 and 1990-1995. The primary problem with the data between 1985 and 1987 is missed tropical cyclones in the North Indian Ocean, and a classification change in Northeast Pacific (both regions contribute a relatively small number to the total global tropical cyclone count).
To address concerns about the validity of intensity data from the earlier periods, Kossin et al. (2013) developed a new homogeneous satellite-derived dataset of hurricane intensity for the period 1982-2009. The lifetime maximum intensity (LMI) achieved by each reported storm is calculated and the frequency distribution of LMI is tested for changes over this period. Kossin et al. found that globally, the stronger tropical cyclones have become more intense at a rate of about +1 m/s per decade during the period (Figure 3.4), but the statistical significance of this trend is marginal. Significant increases in the strongest hurricanes have occurred in the North Atlantic and decreases in the Western North Pacific.
Figure 3.3. (a) Pentad total of the number of hurricanes that achieved a maximum intensity of each category grouping as delineated by the Saffir–Simpson scale. (b) As in (a), but for the percentage of total hurricanes achieving each category grouping. Klotzbach and Landsea (2015)
Figure 3.4. Plots of quantiles (mean to 0.9) of the lifetime maximum intensity (LMI) of storms in the various tropical cyclone formation basins, from a homogenized satellite-based analysis of tropical cyclone intensity (1982–2009). Kossin et al. (2013).
3.1.2 Intensification
Apart from the issue of maximum lifetime intensity achieved by a hurricane, the rate of intensification of hurricanes is receiving increasing scrutiny.
A recent study showed the 95th percentile of 24-h intensity changes significantly increased in the central and eastern tropical Atlantic basin during the period 1986–2015 (Balaguru et al, 2018). The intensification rate increased significantly between 1977 and 2013 in the West Pacific (Mei et al, 2016). In both the Atlantic and West Pacific, the areas with the largest increase in sea surface temperatures (SSTs) were collocated with the largest positive changes in intensification rates.
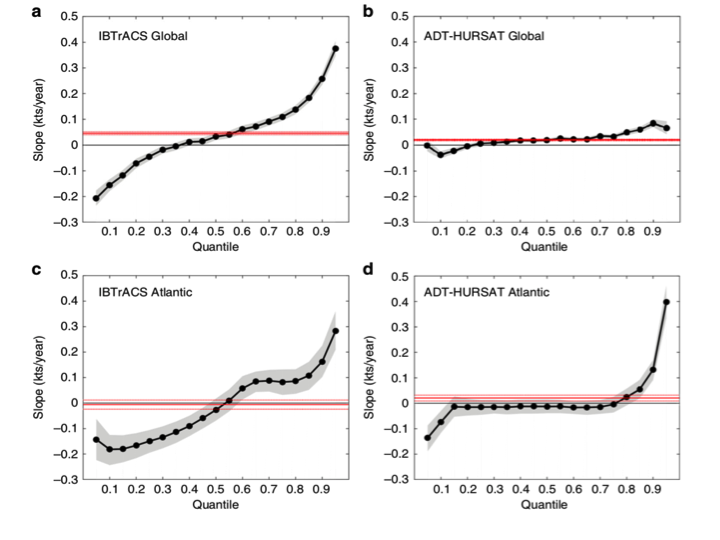
Bhatia et al. (2019) conducted a comprehensive analysis of global rates (excluding the Indian Ocean) of hurricane intensification for the period 1982-2009 (Figure 3.5). Evaluation of the global data is hampered by intensity analysis uncertainties, although the intensity uncertainty is very low for the North Atlantic. In the two most reliable long-term observational records available for hurricane intensity changes, the proportion of the highest 24-hour hurricane intensification significantly increased in the Atlantic between 1982 and 2009. Globally, a significant increase in hurricane intensification rates is seen in IBTrACS data but not in ADT-HURSAT (satellite-derived).
Figure 3.5 Quantile regression of 24-h intensity changes. Slope of the quantiles for 24-h intensity changes during the period 1982–2009. Slopes are shown for IBTrACS (a, c) and ADT-HURSAT (b, d) globally (a, b) and in the Atlantic basin (c, d). Source: Bhatia et al. (2019)
3.1.3 Tracks
Recent research has highlighted variation in the speed and location of hurricane tracks. These variations are significant in changing landfall locations and hurricane-induced rainfall.
Kossin (2018) showed that that tropical-cyclone translation speed (rate of forward motion) has decreased globally by 10 per cent over the period 1949-2016 (Figure 3.6). The global distribution of translation speed exhibits a clear shift towards slower speeds in the second half of the period.
This slowdown is found in both the Northern and Southern Hemispheres but is stronger and more significant in the Northern Hemisphere, where the annual number of tropical cyclones is generally greater. The times series for the Southern Hemisphere exhibits a change-point around 1980 (Figure 3.6), but the reason for this is not clear. An overall slowdown while over water was found in every basin except the northern Indian Ocean. The largest slowdown was found in the western North Pacific Ocean and the region around Australia.Figure 3.6 Global (a) and hemispheric (b) time series of annual-mean tropical-cyclone translation speed and their linear trends. Grey shading indicates 95 percent confidence bounds. Source: Kossin (2018).
In addition to the global slowing of hurricane translation speed, there is evidence that hurricanes have migrated poleward in several regions. Migration in the western North Pacific was found to be large, which has had a substantial effect on regional hurricane-related hazard exposure.
Kossin et al. (2014) identified a pronounced poleward migration in the average latitude where tropical cyclones have achieved their lifetime-maximum intensity (LMI) over the period 1982-2012. The poleward trends are evident in both the Northern and Southern Hemispheres, with an average migration of tropical cyclone activity away from the tropics at a rate of about 1° latitude per decade. In the Northern Hemisphere, the western North Pacific shows the largest migration, with the North Atlantic showing essentially no trend.
Moon et al. (2015) suggested that the poleward migration is greatly influenced by regional changes in hurricane frequency associated with multi-decadal variability, particularly for the Northern Hemisphere (NH). Moon et al. found 92% of the poleward trend is a result of the frequency changes associated with multi-decadal variability.
Daloz et al. (2018) examined whether the poleward migration of hurricane lifetime-maximum intensity is associated with a poleward migration of hurricane genesis (formation). They found a shift toward greater average potential number of genesis at higher latitudes over most regions of the Pacific Ocean, which is consistent with a migration of tropical cyclone genesis towards higher latitudes. They also found significant poleward shifts in mean genesis position over the Pacific Ocean basins.
3.1.4 Rainfall
Walsh et al. (2015) concluded that for the globe, a detectable change in tropical cyclone-related rainfall has not been established by existing studies. However, satellite data is being increasingly used to assess tropical cyclone rainfall.
Kim and Ho (2018) examined the variation of hurricane rainfall area over the subtropical oceans using satellite radar precipitation data collected from 1998 to 2014. In the subtropics, higher translation speed and larger vertical wind shear significantly contribute to an increase in hurricane rainfall area by making horizontal rainfall distribution more asymmetric, while sea surface temperature rarely affects the fluctuation of hurricane rainfall area. They suggested that in the subtropics, unlike the tropics, atmospheric circulation conditions are likely more crucial to varying hurricane rainfall area than factors such as sea surface temperature.
3.3 North Atlantic
The North Atlantic has the best data quality of any of the regions. There is credible data on frequency and intensity since 1850, with the intensity data being most reliable since 1944, when aircraft reconnaissance flights began. Prior to the onset of satellite coverage in 1966, NOAA has adjusted total basin-wide counts upward based on historical records of ship track density. During years when fewer ships were making observations in a given region, hurricanes in that region were more likely to have been missed, or their intensity underestimated to be below hurricane strength, leading to a larger corresponding adjustment to the count for those years. These adjustment methods are cited in Knutson et al. (2010).
The impact of undercounting is illustrated in Figure 3.7, which compares the raw hurricane counts (green) with adjusted counts (orange) for the period 1878-2015. The sign of the long-term trend depends critically on the adjustment.
Figure 3.7. Time series for the period 1878-2015 of the total number North Atlantic hurricanes – unadjusted (green); adjusted (orange). The number of U.S. landfalling hurricanes is in red. Curves have been smoothed using a five-year average, plotted at the middle year. Source: https://www.epa.gov/climate-indicators/climate-change-indicators-tropical-cyclone-activity
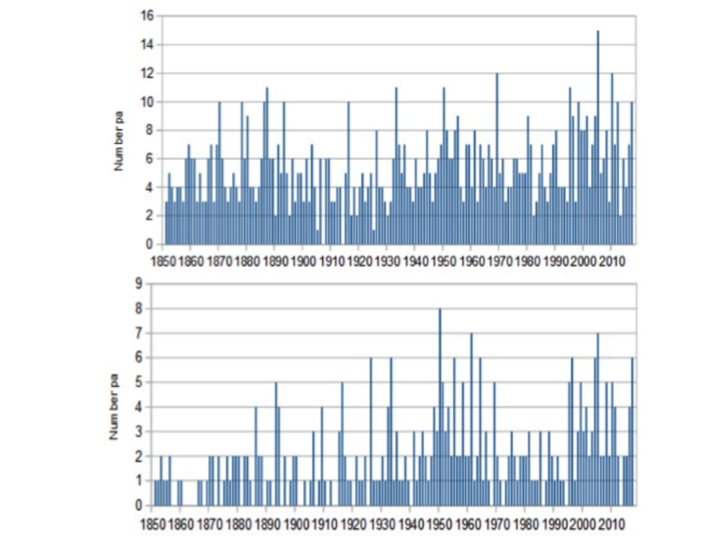
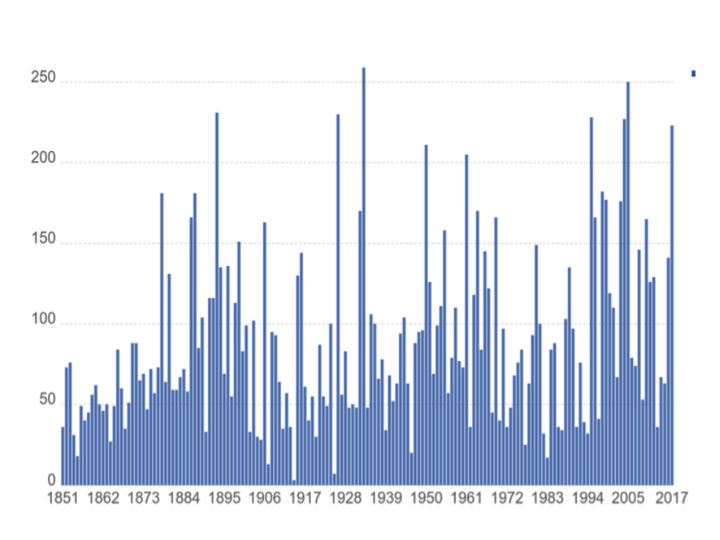
Figure 3.8 shows the yearly values for the adjusted time series since 1850, for total North Atlantic hurricane counts and major hurricane counts. While the number of major hurricanes prior to 1944 is probably undercounted, it is noteworthy that the number of major hurricanes during the 1950’s and 1960’s was at least as large as the last two decades.
Figure 3.8 Adjusted numbers of total Atlantic hurricanes (top) and major hurricanes (bottom). Source: http://www.aoml.noaa.gov/hrd/hurdat/comparison_table.html
Accumulated Cyclone Energy (ACE) (Figure 3.9) and Power Dissipation Index (PDI) (Figure 3.10) provide integral measures of overall hurricane activity, with PDI providing greater weight to intensity. Values of ACE during the 1950’s and 1960’s are comparable to recent decades. Regarding PDI, the years 1926, 1934 and 1962 have PDI values as large as seen in 2004, 2005, 2017, although prior to 1944 intensity data is less reliable.
Figure 3.9 Accumulated Cyclone Energy Index for the Atlantic Ocean. Source: http://www.aoml.noaa.gov/hrd/hurdat/comparison_table.html. Ourworldindata.org
Figure 3.10 Power Dissipation Index (PDI) for the North Atlantic From 1920-2018. Source: Ryan Maue.
All measures of Atlantic hurricane activity show a significant increase since 1970. However, high values of hurricane activity (comparable to the past two decades) were also observed during the 1950’s and 1960’s, and by some measures also in the late 1920’s and 1930’s.
3.4 Paleotempestology
Hurricane data records for the past 40 years, or even the past 150 years, can present a misleading picture of range of variability of hurricane characteristics. Paleotempestology is the study of storm occurrence prior to the historical record. This provides a way of establishing a longer climate baseline than the relatively short observational record.
Many types of geological proxies have been tested for reconstructing past hurricane activity, including hurricane-induced deposits of sediments in coastal lakes and marshes, stalagmites in caves, tree rings and corals. Since these studies typically focus on a specific geographic location, a caveat is that they cannot distinguish between regional trends and systematic changes in hurricane tracks.
In the Australian region, Haig et al. (2014) used oxygen isotopic analysis of stalagmite records to show that the present low levels of storm activity on the mid west and northeast coasts of Australia are unprecedented over the past 1,500 years. Their results reveal a multicentennial cycle of tropical cyclone activity, the most recent of which commenced around AD 1700. The present cycle includes a sharp decrease in activity after 1960 in Western Australia.
Nyberg et al. (2007) constructed a record of the frequency of major Atlantic hurricanes over the past 270 years using proxy records in the Caribbean from corals and a marine sediment core. The record indicates that the average frequency of major hurricanes decreased gradually from the 1760s until the early 1990s, reaching anomalously low values during the 1970s and 1980s.
Wallace et al. (2015) review paleo-trends in hurricane activity from sedimentary archives in the Gulf of Mexico, Caribbean and western North Atlantic margins. A site from Mattapoisett Marsh, Massachusetts shows that the total hurricane deposits have remained relatively constant between 2200 and 1000 years B.P. (before present). However, the last 800 years B.P. appear to have been a time of relatively frequent total storm deposition. A site from Laguna Playa Grande, Puerto Rico has reconstructed intense hurricanes occurring over the past 5000 years B.P., with prominent increases in activity observed during 4400 – 3600, 2500 – 1000, and 250 – 0 years B.P. In the Gulf of Mexico, while the overall frequency of events remained relatively constant over the 4500 year record, the frequency of high threshold events has varied considerably – periods of frequent intense hurricane strikes occurred during 3950 – 3650, 3600 – 3500, 3350 – 3250, 2800 – 2300, 1250 – 1150, 925 -875, and 750 – 650 years B.P.
Brandon et al. (2013) found a period of increased intense hurricane frequency between ~1700 and ~600 years B.P. and decreased intense storm frequency from ~2500 to ~1700 and ~600 years B.P. to the present.
There has not been a timeline or synthesis of these results for the past five thousand years, either regionally or for the entire coastal region. However, it is clear from these analyses that significant variability of landfall probabilities occurs on century to millennial time scales. There appears to have been a broad ‘hyperactive period’ from 3400 to 1000 years B.P. High activity persisted in the Gulf of Mexico until 1400 AD, with a shift to more frequent severe hurricane strikes from the Bahamas to New England occurring between 1400 and 1675 AD. Since 1760, there was a gradual decline in activity until the 1990’s.
3.4 Conclusions
Analyses of both global and regional variability and trends of hurricane activity provide the basis for detecting changes and understanding their causes.
The relatively short historical record of hurricane activity, and the even shorter record from the satellite era, is not sufficient to assess whether recent hurricane activity is unusual for during the current interglacial period. Results from paleotempestology analyses in the North Atlantic at a limited number of locations indicate that the current heightened activity is not unusual, with a ‘hyperactive period’ apparently occurring from 3400 to 1000 years before present.
Global hurricane activity since 1970 shows no significant trends in overall frequency, although there is some evidence of increasing numbers of major hurricanes and of an increase in the percentage of Category 4 and 5 hurricanes.
In the North Atlantic, all measures of hurricane activity have increased since 1970, although comparably high levels of activities also occurred during the 1950’s and 1960’s.