by Judith Curry
In looking for causes, I have applied the ‘Sherlock Holmes procedure’ of eliminating one suspect after another. The procedure has left us without any good suspect. Thermal expansion was the candidate of choice at the time of the first IPCC review. The computed steric rise is too little, too late, and too linear. – Walter Munk
Introduction
To make credible predictions of future sea
level rise, we must first understand the mechanisms of past and current sea level change. The issues of detecting recent acceleration in sea level rise and arguments attributing sea level rise to human caused global warming deserve critical evaluation, in context of identifying any possible indicators of a high sea level projection pathway in the 21st century.
The outstanding issue in the scientific debate surrounding sea level rise is whether the elevated rates during recent decades represent acceleration in the long-term rate of change that can be attributed to human-caused warming, or a temporary increase due to natural climate variability.
Detection and attribution of anthropogenic signals in sea level change is a new and rapidly developing field. In the terminology of the IPCC, detection seeks to demonstrate a statistical change in the climate system, while attribution evaluates the contribution of multiple causes to such a change.
There are three main challenges to identifying a sea level rise signal from human-caused global warming:
- The timescales in the ocean are very long, and there is substantial lag time between external forcing and the realization in sea level change
- High amplitude natural internal variability in the ocean basins on time scales from the interannual to the millennial
- Strong regional variations in the signal.
Statements from the IPCC AR5
In the IPCC AR5 Chapter 10 on Detection and Attribution, there was no formal attribution analysis of total sea level change. However, the AR5 made the following statements regarding sea level rise, glaciers and ice sheets. Here are the key summary statements (from the SPM):.
It is very likely that there is a substantial anthropogenic contribution to the global mean sea level rise since the 1970s. This is based on the high confidence in an anthropogenic influence on the two largest contributions to sea level rise, that is thermal expansion and glacier mass loss.
Anthropogenic influences likely contributed to the retreat of glaciers since the 1960s and to the increased surface mass loss of the Greenland ice sheet since 1993. Due to a low level of scientific understanding there is low confidence in attributing the causes of the observed loss of mass from the Antarctic ice sheet over the past two decades.
Lets look at the details on glaciers and ice sheets from Chapters 4 and 10, to see what was going on before 1993 and 1960.:
Glaciers and Greenland ice sheet
“Over Greenland, temperature has risen significantly since the early 1990s, reaching values similar to those in the 1930s.” [Chapter 4, p 353]
“Along Greenland’s west coast temperatures in 2010 and 2011 were the warmest since record keeping began in 1873 resulting in the highest observed melt rates in this region since 1958.” [Section 10.5.2]
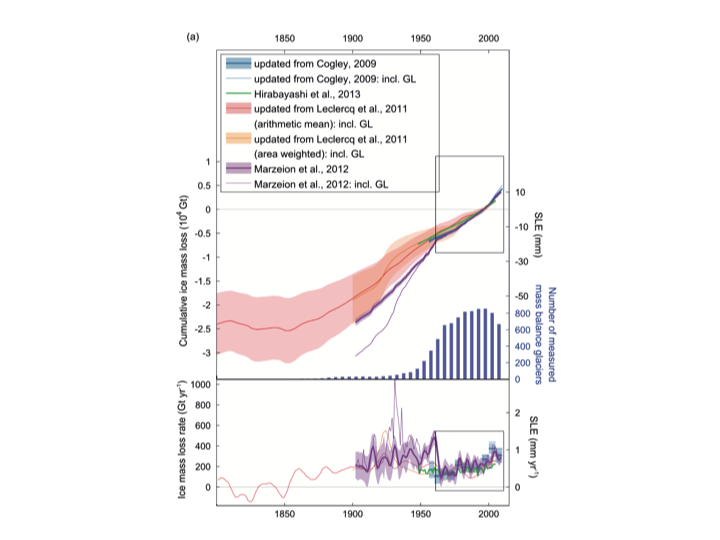
“The arithmetic-mean estimate of Leclercq et al. (2011) indicates continuous mass loss from glaciers after about 1850 (Figure 4.12a, top). Most notable is the rapid loss from Greenland glaciers in the Marzeion et al. simulations during the 1930s. Other studies support rapid Greenland mass loss around this time.” [Chapter 4, p. 343-344]
Figure 4.12 Global cumulative (top) and annual (lower) glacier mass change.
“Overall, there is very high confidence that globally, the mass loss from glaciers has increased since the 1960s, and this is evident in regional-scale estimates” [Chapter 4, p343-344]
“There is very high confidence that the Greenland ice sheet has lost ice and contributed to sea level rise over the last two decades.” [Chapter 4, p 349]
JC COMMENT: Figure 4.12 indicates the recent onset of glacier melting occurred around 1850, with maximum rates of melting in 1900-1960.1960 was a low point, with much higher mass loss from glaciers prior to 1960. The IPCC’s main conclusions refer to ‘since the 1960s’ and ‘since the 1970s’, conveniently neglecting what was going on in the early half of the 20th century.
Antarctica
“West Antarctic ice sheet and the Antarctic Peninsula are losing mass at an increasing rate, but that East Antarctica gained an average of 21 ± 43 Gt yr–1 between 1992 and 2011.” [Chapter 4, p 352]
“In West Antarctica, the warming since the 1950s, the magnitude and seasonality of which are still debated, has not manifested itself in enhanced surface melting nor in increased snowfall.” [Chapter 4, p 354]
“Due to a low level of scientific understanding there is low confidence in attributing the causes of the observed loss of mass from the Antarctic ice sheet since 1993.” [Section 10.5.2]
“Anthropogenic forcing have likely made a substantial contribution to surface temperature increases since the mid 20th century over every continental region except Antartica.” [SYR SPM 1.2]
JC comment: with all the alarms about possible collapse of the West Antarctic Ice Sheet and the attendant sea level rise, there is little to no evidence in the recent observations to support this.
Causes of 20th century sea level rise
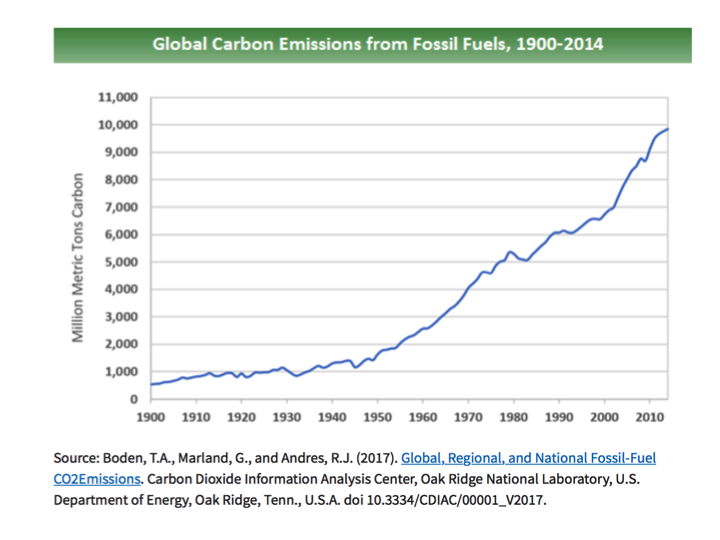
The overall increase of sea level since the mid 19th century and the rising concentrations of atmospheric CO2 naively suggests a causal relation.
The two figures below illustrate the challenge of attributing long-term sea level rise to human caused global warming associated with CO2 emissions. These figures show that global sea levels were rising steadily long before fossil fuels emissions became substantial. As Munk stated in his ‘enigma’ paper: “the historic rise started too early, has too linear a trend’
Since CO2 emissions from fossil fuels didn’t become substantially large until after 1950, understanding the causes of recent sea level rise is clearly more complex than a naïve attribution to increasing levels of atmospheric CO2.
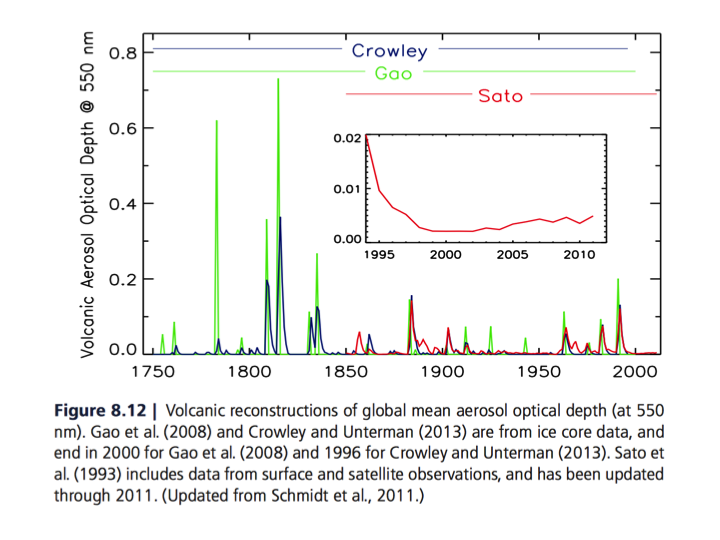
Analyzing the 20th century sea level rise budget, Gregory et al. (2013) found that the largest contribution to global mean sea level rise was from glaciers, and that its rate was the same in both the first and second half of the century, despite the secular warming trend over the course of the century. In the latter half of the nineteenth century, sea level was recovering from large volcanic eruptions and reduced solar irradiance that occurred earlier in the 19th century, which can explain the nineteenth-century onset of glacier mass loss. In the early twentieth century, warming in northern high latitudes probably increased the rate of global mean sea level rise because of mass loss by glaciers and/or the Greenland ice sheet. These natural upward fluctuations of sea level happened to lead into the start of pronounced anthropogenic forcing, and the relative constancy of the rate for most of the century was partly due to greater negative volcanic forcing since the 1960s.
Let’s take a look at the volcanic forcing since the 18th century, from Chapter 8 of the AR4. Large volcanic eruptions are seen in the first half of the 18th century, a lull in volcanic activity during 1920-1960, with an increase in volcanic activity in the last 4 decades of the 20th century.
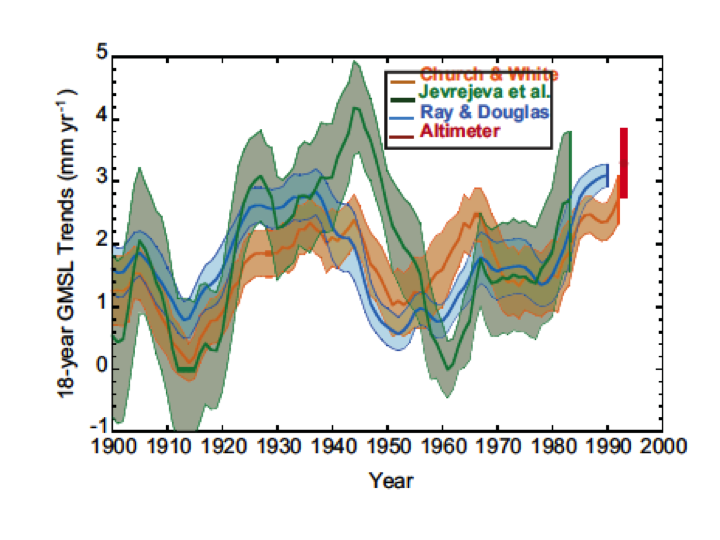
I continue to be intrigued by the ‘bump’ in the rate of sea level rise mid-20th century. The IPCC AR5 acknowledged this ‘bump’:
“It is very likely that the mean rate of global averaged sea level rise was 1.7 [1.5 to 1.9] mm yr–1 between 1901 and 2010, 2.0 [1.7 to 2.3] mm yr–1 between 1971 and 2010 and 3.2 [2.8 to 3.6] mm yr–1 between 1993 and 2010. It is likely that similarly high rates occurred between 1920 and 1950.”
The rate of global mean sea level change as portrayed in AR5 is shown belowFigure caption: 18-year trends of global mean sea level rise estimated at 1-year intervals. The time is the start date of the 18-year period, and the shading represents the 90% confidence. The estimate from satellite altimetry is also given, with the 90% confidence given as an error bar. [AR5 WGI Figure 3.14]
I just spotted a more recent version of this diagram in the CLIVAR 2018 Winter Edition Special issue on Sea Level Rise, which gives a 20th century trend of 1.3 ± 0.2 mm/yr.
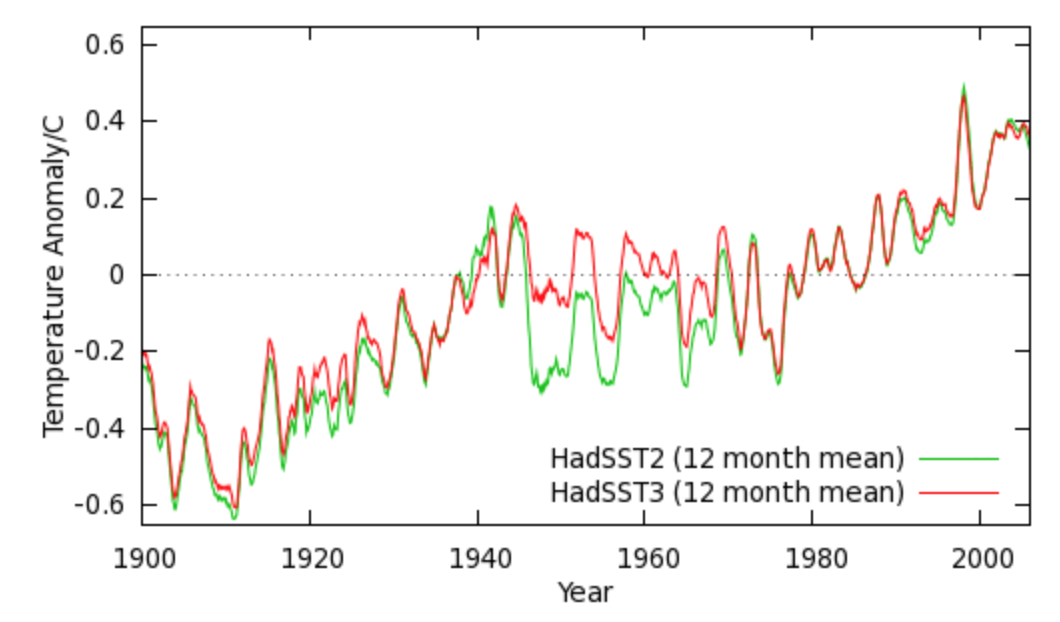
Global average sea surface temperatures from CRU since 1900 are shown below:
Figure caption: Global average sea surface temperature anomalies from the HadSST (to 2012)
We see that global mean sea surface temperatures in the 1940’s were about 0.4oC lower than 21st century temperatures. It doesn’t seem that thermal expansion can explain the mid-century high rates of sea level rise.
So what explains the ‘bump’ in the rate sea level rise mid 20th century? I didn’t find this in any of the IPCC assessment reports.
Budgets
Insights into the causes of sea level rise are provided by efforts to understand the budget of sea level rise.
This Table (from my 2014 congressional testimony) summarizes contributions to sea level rise from different sources (mm per year), from both the IPCC AR4 and AR5 Reports:Thermal expansion is one third smaller in AR5 and land water storage with a substantial amount is completely new in AR5, while the sum of these sources remained constant. The growing realization of the importance of land water storage to sea level rise is diminishing the percentage of sea level rise that is associated with warming.
Jevrejeva et al. (2016) provide a review of recent progress and challenges in balancing the 20th century sea level budget. Much recent progress has been made in clarifying the budget for the satellite era (since 1993).
Chen et al. (2017) provide an updated analysis of the budget of sea level rise during the satellite era. The key findings:
“Here we show that the rise, from the sum of all observed contributions to GMSL, increases from 2.2 ± 0.3mmyr−1 in 1993 to 3.3 ± 0.3mmyr−1 in 2014. The mass contributions to GMSL increase from about 50% in 1993 to 70% in 2014 with the largest, and statistically significant, increase coming from the contribution from the Greenland ice sheet, which is less than 5% of the GMSL rate during 1993 but more than 25% during 2014.”
Figure 4 from Chen et al. shows the time series of the budget components. The steric component of the rate of sea level rise (related to ocean temperature increase) shows a lower value in 2014 than in 1993 (apparently associated with the lingering effects from the Pinatubo eruption). The increase in the rate of sea level rise is largely attributed to the Greenland ice sheet.
Greenland
The recent acceleration in the mass loss from Greenland motivates a focused look at the mass balance of the Greenland ice sheet.
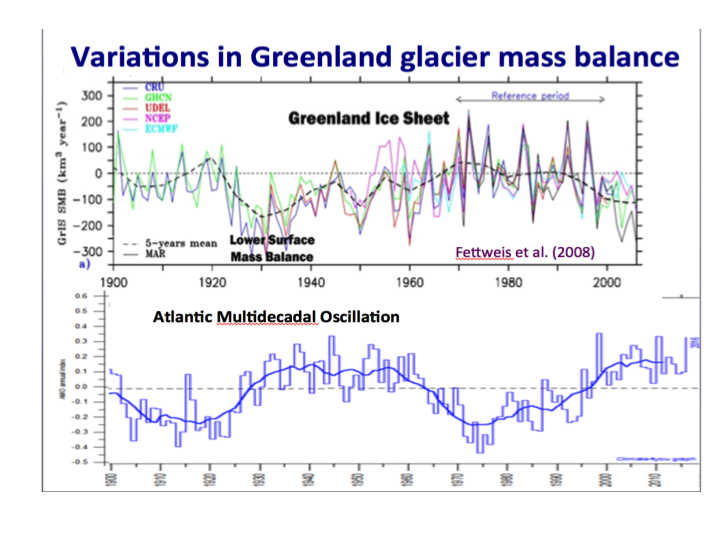
An article by Fettweis et al. (2008) estimates the Greenland mass balance for the 20th century. A key conclusion:
“These estimates show that the high surface mass loss rates of recent years are not unprecedented in the [Greenland ice sheet] history of the last hundred years. The minimum [surface mass balance] rate seems to have occurred earlier in the 1930s”
It is seen that the largest negative values of the surface mass balance occur during the period ~1925 – 1940, and then since 1995.
When I first saw the above figure, it immediately clicked in my mind that we were seeing the affects of the Atlantic Multidecadal Oscillation (AMO). The figure below lines up the AMO index with the Fettweis et al. diagram of Greenland ice sheet mass balance:
The implications of this relationship for sea level rise attribution is rather profound – the negative early 20th century mass balance for Greenland is coincident with the ‘bump’ in rate of sea level rise noted in the section on Causes of the 19th and 20th century sea level rise, including Figure 3.14 from the IPCC AR5 WG1 Report.
Reeves and Zeng (2017) have reviewed the various surface air temperature datasets for Greenland.
There are substantial discrepancies in these datasets, although all of them show some sort of maxima in the early 20th century. I am inclined to go with Box, which is compiled by a scientist that has devoted his career to studying this. In terms of anomalies (not absolute values), Berkeley Earth agrees reasonably well with Box.
Greenland was anomalously warm in the 1930’s and 1940’s, with temperatures comparable to 21st century temperatures.
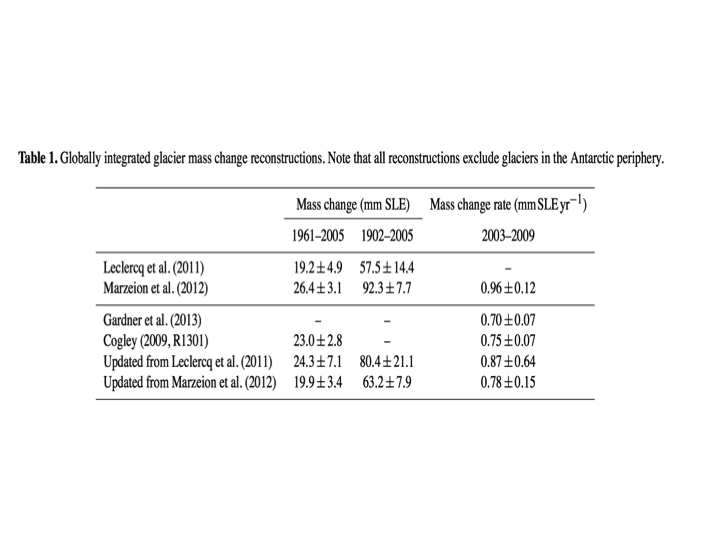
The acceleration of ice loss during the early part of the 20th century was not limited to Greenland. Marzeion et al. (2012) describe the past mass balance of glaciers (excluding Antarctica), and includes an excellent analysis of uncertainties. Excerpt:
Rates of mass loss during the 20th century were characterized by generally faster mass loss of approximately 1.5 mm SLE yr−1 during the first half of the century, caused by Greenland in the 1930s, Arctic Canada in the 1950s to early 1960s, and the Russian Arctic in the late 1950s and 1960s. Rates then dropped to a low of around 0.5 mm SLE yr−1 during the 1970s, and since then have been gaining speed again to currently approximately 1.0 mm SLE yr−1.
Marzeion et al.’s analysis includes glaciers from low latitudes and the southern hemisphere, but in terms of volume and surface area they are dominated by those from the high latitudes of the Northern Hemisphere.
Marzeion et al. published an update in 2015, reconciling some of the differences in different estimates of glacier mass change:Updates to the Leclerq and Marzeion studies show significant changes; increasing the values of the Leclerq analysis and decreasing the values of the Marzeion analysis, bringing them into closer agreement. It is not clear from the Marzeion et al. (2015) paper whether this changes the relative amplitude during the 1930’s.
LeClerq et al. have developed a new data set of worldwide glacier length fluctuations. The paper’s key conclusion:
“The available glacier length series show relatively small fluctuations until the mid-19th century, followed by a global retreat. The retreat was strongest in the first half of the 20th century, although large variability in the length change of the different glaciers is observed.”
Well, I am not the first person to make the connection between Greenland ice sheet melt and the AMO:
- Hanna (2013) The influence of North Atlantic atmospheric and oceanic forcing effects on 1900-2010 Greenland summer climate and ice runoff “Correlation analysis of Greenland coastal weather station temperatures against the North Atlantic Oscillation (NAO) and the Atlantic Multidecadal Oscillation (AMO) indices for the summer season reveals significant temporal variations over the last 100 years, with periods of strongest correlations in the early twentieth century and during recent decades.”
- Mernild and Liston (2012): Greenland freshwater runoff. Part II: Distribution and trends, 1960-2010 “In general, years with positive Atlantic multidecadal oscillation (AMO) index equaled years with relatively high Greenland runoff volume and vice versa.”
- Mernild et al. (2017) Reconstruction of the Greenland ice sheet surface mass balance and the spatiotemporal distribution of freshwater runoff from Greenland to the surrounding seas “This suggests that natural variabilities in AMO and NAO constitute major controls on catchment-scale runoff variations in Greenland.”
A recent paper by Hover et al. provides insights into how the AMO and NAO influence the Greenland mass balance:
“The Greenland Ice Sheet (GrIS) has been losing mass at an accelerating rate since the mid-1990s. We show, using satellite data and climate model output, that the abrupt reduction in surface mass balance since about 1995 can be attributed largely to a coincident trend of decreasing summer cloud cover enhancing the melt-albedo feedback. The observed reduction in cloud cover is strongly correlated with a state shift in the North Atlantic Oscillation promoting anticyclonic conditions in summer and suggests that the enhanced surface mass loss from the GrIS is driven by synoptic-scale changes in Arctic-wide atmospheric circulation.”
JC note: the anticyclonic conditions would also reduce precipitation.
Detection of recent sea level rise acceleration
Identification of a statistical change in the sea level record is confounded by the existence of long-term memory and the large magnitude of internal variations in the ocean. When the magnitude of a trend is greater than some threshold that scales the influence from long-term memory and internal variations, the sign of the estimated trend can be interpreted as the underlying long-term change.
Recent research in sea level rise detection is increasingly based on more sophisticated analyses of long-term memory and persistence. Sea level variability has a strong long-term memory that implies an enhancement of the uncertainty in the observed trends. Knowing the persistence of natural sea level rise enables a statistical assessment of the probability that the recent rise is outside the range of natural variability. This persistence, which is described by the Hurst exponent, leads naturally to multi-decadal excursions from the mean state and can therefore produce relatively strong multi- decadal to centennial trends unrelated to any external forcing.
At the regional scale, detection studies on sea level are highly challenging. The internal climate variability introduces strong changes in regional sea level on timescales from years to decades (and even longer), making it very difficult to detect an external signal above the unforced internal variability. For example, the internal sea level variability related to ENSO and to the Pacific Decadal Oscillation (PDO) is of the order of ±10–20 cm, which masks the sea level changes due to any externally forced signal.
Marcos et al. (2016) summarizes recent research on sea level rise detection. Several ‘Time of Emergence’ (ToE) studies have been performed on regional sea level variability. ToE is defined as the time when the ratio of the climate change signal to the noise of natural variability exceeds a particular threshold and emerges from the natural climate variability at regional scale. Time of emergence seems to be essentially synonymous with ‘detection.’
JC query: I’m not sure how to interpret ToE in terms of attribution to AGW, seems at least 50%, but possibly more stringent.
Lyu et al. (2014) found that the externally forced trend would be detectable in both steric and dynamic sea level by early to mid-2040s in 50% of all the oceans, under representative concentration pathways (RCP) 4.5 and RCP8.5 scenarios. Richter and Marzeion (2014) argue that the externally forced signal should be detectable in the early 2030s relative to 1990 in the South Atlantic Ocean, Arctic Ocean, eastern Pacific Ocean, and most parts of the Indian Ocean. Jorda` (2014) has shown that, on average, it would require a minimum period of 40 years to identify the externally forced signal at the regional scale. However, in regions with strong decadal and inter-annual sea level variability, the emergence time increases up to 60–80 years. Bilbao et al. (2015) argues that the local sea level change will emerge first in the northern latitudes of the Southern Ocean and in the Tropical Atlantic, where the unforced internal variability is smaller. In contrast, at southern latitudes of the Southern Ocean, it may not emerge until after 2100. Overall, these papers find that in regions of high internal variability, the trend due to externally forced signal is masked during longer time spans than in regions of low internal variability.
The Time of Emergence analyses argue that we have not yet detected unusual sea level rise in any of the individual ocean basins. But as we will see in the following section, this hasn’t impeded attribution analyses that assign cause to AGW.
Attribution of recent sea level rise
Two early papers (circa AR5) came to opposite conclusions regarding the attribution of recent sea level rise. Jevrejeva et al. (2009) used a statistical model that showed that anthropogenic forcing was responsible for up to 70% of sea level rise since 1900. Gregory et al. (2013) stated:
“The largest contribution to GMSLR during the twentieth century was from glaciers, and its rate was no greater in the second half than in the first half of the century, despite the climatic warming during the century. Of the contributions to our budget of GMSLR, only thermal expansion shows a tendency for increasing rate as the magnitude of anthropogenic global climate change increases, and this tendency has been weakened by natural volcanic forcing. Greenland ice sheet contribution relates more to regional climate variability than to global climate change; and the residual, attributed to the Antarctic ice sheet, has no significant time dependence. The implication of our closure of the budget is that a relationship between global climate change and the rate of GMSLR is weak or absent in the twentieth century. The lack of a strong relationship is consistent with the evidence from the tide gauge datasets, whose authors find acceleration of GMSLR during the twentieth century to be either insignificant or small.”
Recent attribution analyses are summarized by a review paper authored by Marcos et al. (2016):
- Becker et al. (2014) estimated the fraction of the observed linear trends at tide gauges and for global sea level that cannot be explained by the long-term memory of sea level variations and that is thus linked to an external forcing. They concluded that the anthropogenic contribution to sea level rise during the twentieth century is more than 50% of the observed global sea level rise rate, with a 99% confidence level.
- Dangendorf et al. (2015) concluded that it is virtually certain that at least 45% of the observed global sea level rise during the twentieth century is of anthropogenic origin, and extremely likely that it is at least 61% and very likely at least 68%.
- Kopp et al. (2016) estimated the anthropogenic fraction as about 50%.
- Slangen et al. (2016) found the anthropogenic forcing explains only 15 ± 55% of the observations before 1950, but increases to become the dominant contribution after 1970 (69 ± 31%), reaching 72 ± 39% in 2000 (37 ± 38% over the period 1900-2005).
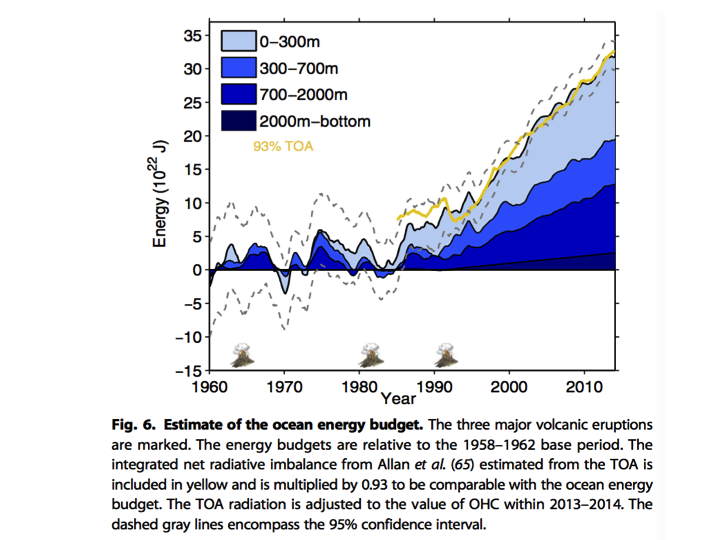
With regards to the thermosteric (temperature) component of the sea level rise, Cheng et al. (2017) found that changes in OHC are relatively small before about 1980; since then, OHC has increased fairly steadily and, since 1990, has increasingly involved deeper layers of the ocean.
Marcos et al. (2016) provides the following summary of attribution of the thermosteric component of the sea level rise:
Based on the comparison between the forced signals in historical simulations and in natural forcing-only simulations using climate models, Marcos and Amores (2014) concluded that, since 1970, 87% (72–100%) of the observed warming-related sea level rise in the 0–700 m of the global ocean is of anthropogenic origin. Slangen et al. (2014), for the period 1957–2005, found that the sea level response to anthropogenic GHG forcing explains most of the magnitude of the observed differences, while the natural forcing is required to explain temporal variability.
Geothermal wild card
In the past few years, a number of papers have been published, suggesting significant geothermal heat sources for the Greenland and Antarctic ice sheets, with implications for their mass balance and contributions to sea level rise.
- A new volcanic province: an inventory of subglacial volcanoes in West Antarctic. De Vries et al. 2017. Geological Society, London, Special Publications,
“We identified 138 volcanoes, 91 of which have not previously been identified, and which are widely distributed throughout the deep basins of West Antarctica, but are especially concentrated and orientated along the >3000 km central axis of the West Antarctic Rift System.“
- Influence of a West Antarctic mantle plume on ice sheet basal conditions. Seroussi et al. Journal of Geophysical Research, 2017
“The experiments show that mantle plumes have an important local impact on the ice sheet, with basal melting rates reaching several centimeters per year directly above the hotspot.”
- Heat Flux Distribution of Antartica Unveiled. Marcos, J. Geophys. Res, 2017.
“Of the basic parameters that shape and control ice flow, the most poorly known is geothermal heat flux. We present a high-resolution heat flux map and associated uncertainty derived from spectral analysis of the most advanced continental compilation of airborne magnetic data.”
- Evidence for elevated and specially variable geothermal flux beneath the West Antarctic Ice Sheet. Schroeder et al. PNAS, 2014.
“We show that the Thwaites Glacier catchment has a minimum average geothermal flux of ∼114 ± 10 mW/m2 with areas of high flux exceeding 200 mW/m2 consistent with hypothesized rift-associated magmatic migration and volcanism.“
- Melting at the base of the Greenland ice sheet explained by Iceland hotspot history. Rogozhina et al., Nature Geoscience 2016
“Ice-penetrating radar and ice core drilling have shown that large parts of the north-central Greenland ice sheet are melting from below. It has been argued that basal ice melt is due to the anomalously high geothermal flux that has also influenced the development of the longest ice stream in Greenland. Here we estimate the geothermal flux beneath the Greenland ice sheet and identify a 1,200-km-long and 400-km-wide geothermal anomaly beneath the thick ice cover.”
The implications for attributing any historical or future sea level rise to ice sheet geothermal activity is unknown at this point, but this seems to be an important knowledge frontier.
Conclusions
Marcos et al. (2016) concluded that “In the last few years, different works have used statistical methodologies to conclude that the natural variability in sea level, i.e. decadal to multi-decadal changes associated with climate variations, cannot explain the observed linear global sea level trend during the past century. There exists therefore an irrefutable fingerprint of an anthropogenic forcing in this key climate change indicator.”
There has been substantial progress since the AR5 on detection and attribution of sea level rise, including some very nice research. However, I am not convinced that all of this evidence is being integrated in the appropriate way in context of seeking to identify the fingerprint of CO2 emissions on sea level rise.
There has been a secular trend of increasing sea levels since the mid 19th century. This is loosely associated with ‘coming out of the Little Ice Age’, presumably caused by a combination of changes in external forcing from volcanoes and the sun and long term ocean circulations. The slow emergence of fossil fuel emissions prior to 1950 is unlikely to have contributed significantly to 19th and early 20th century sea level rise.
Before attempting to pin the recent acceleration in global mean sea level rise on fossil fuel emissions, I would argue that the sea level rise data set does not pass the ‘detection’ test. From the IPCC AR4 :
‘Detection’ is the process of demonstrating that climate has changed in some defined statistical sense, without providing a reason for that change. An identified change is ‘detected’ in observations if its likelihood of occurrence by chance due to internal variability alone is determined to be small.
So what exactly is the ‘detection’ metric we should be looking at? Two possibilities:
- Sea level since 1950
- Rate of sea level change since 1950
Sea level is now higher than it was in 1950. This does not seem to be a very useful metric, since here has been nearly linear sea level rise since ~1860. The rates of sea level rise since 1993 are comparable to those observed in the first half of the 20th century (given the uncertainties), i.e., no detection of change since 1950. Separating the rates of sea level rise into steric and mass components doesn’t help much either – the main acceleration signal is seen in the mass component from Greenland and glaciers, but the recent signal is smaller than was seen circa the 1930’s.
Failure to pass a ‘detection’ test is borne out by the numerous ‘time of emergence’ analyses that don’t expect the anthropogenic sea level rise signal to rise above natural variability until the mid 21st century (or later)..
Failure to pass a ‘detection’ test should not preclude attribution analyses (and it hasn’t), but any attribution analysis should recognize the reasons for the lack of detection – multi-decadal internal variability.
With regard to the detection of the impact on seal level rise of fossil fuel emissions from 1900-2005, the conclusion from Slangen et al. (2016) seems reasonable: 37 ± 38%. With regards to more recent sea level rise, estimates range from 45 to 69%. While I have low confidence in these numbers, I find the sea level rise attribution analyses conducted by oceanographers to be eminently more sound than those conducted by atmospheric scientists regarding attribution of warming since 1950 (where their best estimate is ~100%). This is because the oceanographers consider the following:
- Natural internal variability on multidecadal and longer timescales
- Analyses of long-term memory and persistence
These two central factors are completely ignored by atmospheric scientists in their attribution analyses of the causes of temperature (and extreme event) increases since 1950.
Why do I have low confidence in the analyses attributing of more than half of recent sea level rise to fossil fuel emissions? The attribution of the thermosteric component relies on climate model simulations, comparing simulations with only natural forcing to those with both natural and anthropogenic forcing. Any contribution from multi-decadal internal variability is essentially zero, since the climate models do not simulate the correct phasing of this variability and averaging of multiple models leaves only the forced changes.
The bottom line for attribution is that if a metric fails the detection text (relative to internal variability), then you can’t then proceed with an attribution analysis that neglects multi-decadal internal variability — this is circular reasoning. Which is what the climate model based attribution analyses do.
The recent acceleration in sea level rise comes from the mass balance component from Greenland, which appears to have been larger during the 1930’s. While some of this reduction in the mass balance could be caused by reduced volcanic activity in the early 20th century, a large component of this appears to be associated with the AMO. The onset of the recent increase from Greenland (circa 1995) coincides with the 1995 shift of the AMO to its warm phase, with changing atmospheric circulation and cloudiness patterns that resulted in more solar warming of Greenland (Hover et al. 2017).
So in spite of all the new high tech data sets and complex climate models and fancy statistical methods, we still don’t know how to separate human caused variations from natural internal variability. Which to me means that we need to rely more heavily on detection and time of emergence arguments than on climate-model based attribution arguments.
I have not seen the early 20th century mass balance of Greenland and the AMO explicitly factored into the recent attribution analyses of sea level rise, I would appreciate any references that you can find on this.
And finally, in context of the ‘blame game’, Slanged et al’s. ~37% of 8 inches since 1900 (Slangen et al.) is enough to cover your toes but not much else if you are standing in a puddle that deep.