by Judith Curry
Suggestions for the climate ‘red team’ response.
This post is motivated by a twitter thread from Andrew Dessler that responds to a recent ruling in the Northern California versus the oil companies lawsuit (discussed previously here)
The judge posed 8 science questions for each side to respond to. Dessler provided his answer to all 8 questions. My post focuses on question #8:
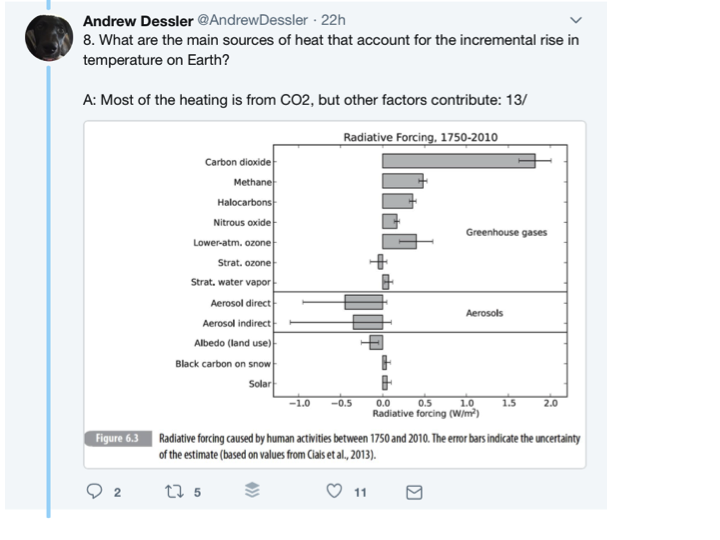
What are the main sources of heat that account for the incremental rise in temperature on Earth?
Dessler responded to the question in the following way:
JC’s response
There are many factors that contribute to changes in the Earth’s global average surface temperature.
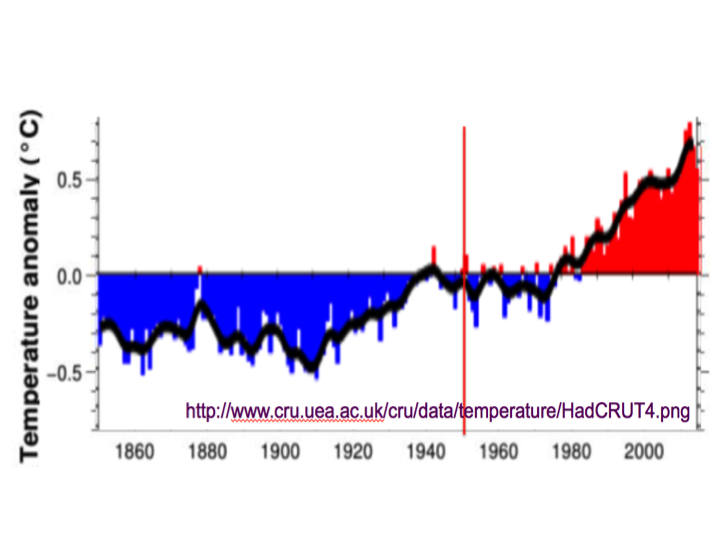
Here is the global mean surface temperature anomalies since 1850. You see a substantial temperature rise from 1910 to 1940, a decline from 1940 to 1975, then a large increase from 1975 to 1998, a small increase from 1998 to 2014, then a recent spike in 2015/2016 associated with the super El Nino.
The IPCC AR5 (2013) concluded that:
“It is extremely likely that more than half of the observed increase in global average surface temperature from 1951 to 2010 was caused by [humans]. The best estimate of the human induced contribution is similar to the observed warming over this period.”
Note: the analyses from climate models and ‘fingerprinting’ analysis point to ~100% attribution to human caused warming since 1951.
The IPCC AR5 examined the radiative forcing from the period 1750 to 2010 (see Figure 6.3 above posted by Dessler).
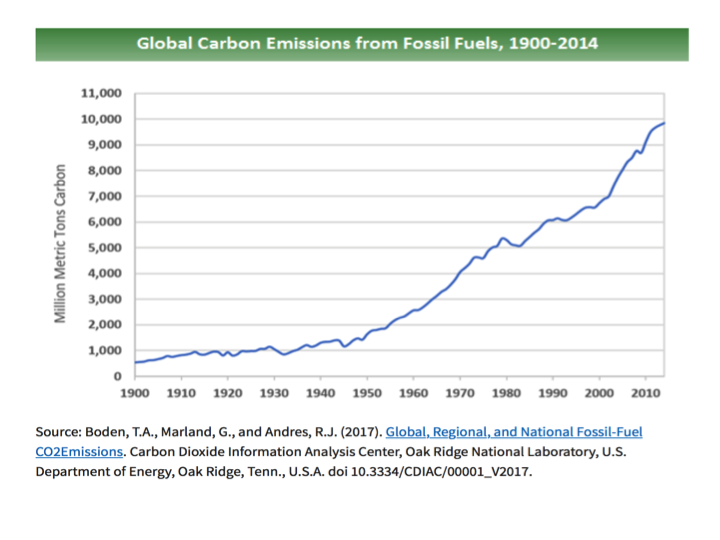
Most of the radiative forcing is from CO2 over this period. However, fossil fuel emissions did not start increasing substantially until after 1950:
The observed warming prior to 1940, the slight decline of temperatures from 1940-1975, and the slowdown in warming from 1998-2014 obviously are not explained by fossil fuel emissions.
The period 1998-2014 was associated with a particularly steep increase in fossil fuel emissions. The IPCC AR5 makes these statements:
“[T]he rate of warming over the past 15 years (1998–2012; 0.05 [–0.05 to +0.15] °C per decade), which begins with a strong El Niño, is smaller than the rate calculated since 1951 (1951–2012; 0.12 [0.08 to 0.14] °C per decade).” [IPCC AR5 SPM, p 5]
“The observed reduction in surface warming trend over the period 1998 to 2012 as compared to the period 1951 to 2012, is due in roughly equal measure to a reduced trend in radiative forcing and a cooling contribution from natural internal variability, which includes a possible redistribution of heat within the ocean (medium confidence). The reduced trend in radiative forcing is primarily due to volcanic eruptions and the timing of the downward phase of the 11-year solar cycle. However, there is low confidence in quantifying the role of changes in radiative forcing in causing the reduced warming trend. There is medium confidence that natural internal decadal variability causes to a substantial degree the difference between observations and the simulations; the latter are not expected to reproduce the timing of natural internal variability. There may also be a contribution from forcing inadequacies and, in some models, an overestimate of the response to increasing greenhouse gas and other anthropogenic forcing (dominated by the effects of aerosols).”
“Nevertheless, several studies claim a role for internal variability associated with the AMO [Atlantic Multidecadal Oscillation] in driving enhanced warming in the 1980s and 1990s as well as the recent slow down in warming” (Box 9.2)
The early century warming and mid century cooling was particularly pronounced in the high northern latitudes:
“Over Greenland, temperature has risen significantly since the early 1990s, reaching values similar to those in the 1930s (Box et al., 2009).” [IPCC AR5 ch 10 p 353]
The AR5 does not specifically address the so-called ‘grand hiatus’ in warming from 1940-1976. The AR4 makes this statement:
“Differences between simulations including greenhouse gas forcing only and those that also include the cooling effects of sulphate aerosols indicate that the cooling effects of sulphate aerosols may account for some of the lack of observational warming between 1950 and 1970, despite increasing greenhouse gas concentrations. The mid-century cooling that the model simulates in some regions is also observed, and is caused in the model by regional negative surface forcing from organic and black carbon associated with biomass burning. Variations in the Atlantic Multi-decadal Oscillation could account for some of the evolution of global and hemispheric mean temperatures during the instrumental period; Knight et al. (2005) estimate that variations in the Atlantic Multi-decadal Oscillation (AMO) could account for up to 0.2°C peak-to-trough variability in NH mean decadal temperatures.” [Section 9.4.1.2]
With regards to the early 20th century warming, the IPCC AR4 states:
“Modelling studies are also in moderately good agreement with observations during the first half of the 20th century when both anthropogenic and natural forcings are considered, although assessments of which forcings are important differ, with some studies finding that solar forcing is more important while other studies find that volcanic forcing or internal variability could be more important.” [Section 9.4.1.2]
The IPCC AR5 makes these statements:
“The AR4 concluded that ‘the early 20th century warming is very likely in part due to external forcing’, and that it is likely that anthropogenic forcing contributed to this warming. This assessment was based on studies including Shiogama et al. (2006) who find a contribution from solar and volcanic forcing to observed warming to 1949, and Min and Hense (2006), who find strong evidence for a forced (either natural or combined natural and anthropogenic) contribution to global warming from 1900 to 1949. Ring et al. (2012) estimate that part of the early 20th century warming was due to GHG increases, but find a dominant contribution by internal variability. CMIP5 model simulations of the historical period show forced warming over the early 20th century, consistent with earlier detection and attribution analyses highlighted in the AR4 and TAR.” [Section 10.3.1]
“The pattern of warming and residual differences between models and observations indicate a role for circulation changes as a contributor to early 20th century warming, and the contribution of internal variability to the early 20th century warming has been analysed in several publications since the AR4. Crook and Forster (2011) find that the observed 1918–1940 warming was significantly greater than that simulated by most of the CMIP3 models. A distinguishing feature of the early 20th century warming is its pattern which shows the most pronounced warming in the Arctic during the cold season, followed by North America during the warm season, the North Atlantic Ocean and the tropics. Such a pronounced pattern points to a role for circulation change as a contributing factor to the regional anomalies contributing to this warming. Some studies have suggested that the warming is a response to the AMO, or a large but random expression of internal variability. Knight et al. (2009) diagnose a shift from the negative to the positive phase of the AMO from 1910 to 1940, a mode of circulation that is estimated to contribute approximately 0.1°C, trough to peak, to GMST. Nonetheless, these studies do not challenge the AR4 assessment that external forcing very likely made a contribution to the warming over this period. In conclusion, the early 20th century warming is very unlikely to be due to internal variability alone. It remains difficult to quantify the contribution to this warming from internal variability, natural forcing and anthropogenic forcing, due to forcing and response uncertainties and incomplete observational coverage.” [Section 10.3.1]
The cloud conundrum
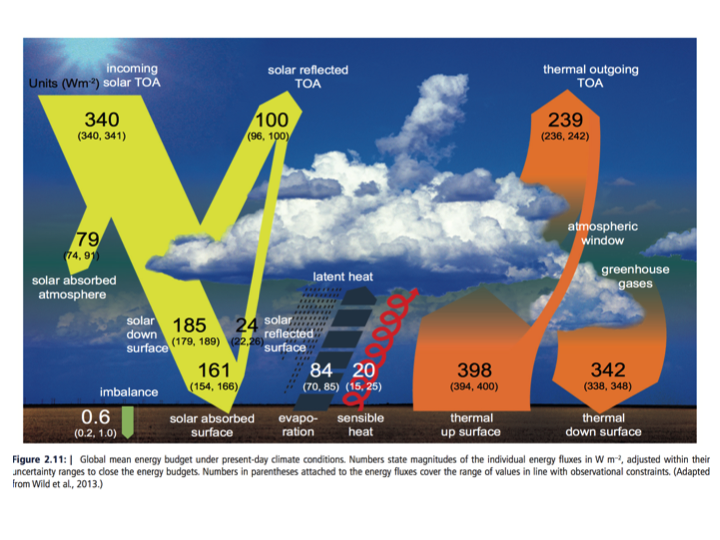
How does internal variability modify global temperatures? Changes in ocean circulations redistribute heat in the ocean and cause changes to atmospheric circulation that change cloudiness. Figure 2.11 shows the Earth’s energy balance:
Clouds have a major influence on the Earth’s energy balance:
“By enhancing the planetary albedo, cloudy conditions exert a global and annual shortwave cloud radiative effect of approximately –50 W m–2 and, by contributing to the greenhouse effect, exert a mean longwave effect of approximately +30 W m–2, with a range of 10% or less between published satellite estimates.” [WG1 AR5 Section 7.2.1.2]
There are strong regional and seasonal variations in the cloud radiative effect, as shown in Figure 7.6 of WG1 AR5 Chapter 7.
Clouds have a major influence on the planetary energy balance. Relative to the magnitudes of changes in radiative forcing shown in Figure 6.3, of magnitude of 1-2 W/m2, the impact of changes in cloudiness can easily exceed this magnitude.
The challenges of understanding the role of clouds in climate change is highlighted by the World Climate Research Programme (WCRP) Grand Challenge on Clouds, Circulation and Climate Sensitivity:
“Limited understanding of clouds is the major source of uncertainty in Climate Sensitivity, but also contributes substantially to persistent biases in modelled circulation systems: how do clouds couple to circulations in the present climate, how will clouds respond to global warming or other forcings, and how will they feed back on it through their influence on Earth’s radiation budget?”
Conclusion
With regards to the IPCC AR5 conclusion:
“It is extremely likely that more than half of the observed increase in global average surface temperature from 1951 to 2010 was caused by [humans]. The best estimate of the human induced contribution is similar to the observed warming over this period.”
I agree that it is extremely likely that fossil fuel emissions have contributed to the warming observed since 1951.
I am not at all convinced by arguments that the human induced contribution is similar to the observed warming (essentially 100%) since 1951.
I find it possible that more than half of the observed increase in global average surface temperature from 1951 to 2010 was caused by fossil fuel emissions, although I regard a ‘as likely as not’ confidence level to be more appropriate than ‘extremely likely.’
Why is there disagreement on this issue?
The IPCC focuses its attribution analysis on the period since 1950 (which is the period when emissions became large, and for which the observational data is the best); however consideration of the early 20th century warming and mid century cooling raises some serious questions about the role of natural variability that the IPCC does not adequately address. Further, the IPCC relies primarily on climate model simulations and a fingerprint detection scheme; these simulations do not include the correct phasing of the natural internal variability and are arguably not fit for the purpose of attribution since the models have been tuned (implicitly and explicitly) using 20th century observations.
This statement from the IPCC AR5 sums it up perfectly:
It remains difficult to quantify the contribution to this warming from internal variability, natural forcing and anthropogenic forcing, due to forcing and response uncertainties and incomplete observational coverage.” [Section 10.3.1]
JC reflections
In an interview on this development in the San Francisco trial, Steve Koonin made the following statement:
“I don’t know of any judge who has asked for a tutorial like this,” said Steven E. Koonin, a physicist and former Energy Department undersecretary known for his contrarian views on global warming research. “I think it is a great idea. Anybody having to make a decision about climate science needs to understand the full spectrum of what we know and what we don’t know.”
Also in the article:
Koonin, who worked for two years in the Obama administration and now teaches at New York University, has long called for a public debate on climate change science. While he agrees that human-caused carbon dioxide has warmed the atmosphere, he takes issue with some computer models about future impacts, and disagrees with calls for drastic changes in energy use.
Writing in the Wall Street Journal last year, Koonin called for a “Red Team/Blue Team” process to debate and test assumptions and conclusions about climate change.
Looks the Red Team will have an easy job of it; all they need to do is read the fine print of the IPCC assessment reports. No need for additional skeptical arguments (although there are a number of them that would arguably be useful in such an assessment).