by Peter Davies
While onshore wind generation has been relatively inexpensive for some time, solar PV and lithium ion battery storage costs have recently shown dramatic reductions. So can Texas, with excellent onshore wind and solar resources, be powered economically entirely by renewables in the 2030-40 time frame? This article brings together the available public material to estimate the cost.
Part 1 of this article looked at the current Texas ERCOT (Electricity Reliability Council of Texas) grid and used an hourly simulation spreadsheet containing actual 2010-12 load, wind and solar irradiance data to investigate the potential increasing use of wind, solar PV and two tiers of storage in the ERCOT grid. Based on a high-level design, the grid hourly simulation results indicate that a full renewable solution for the ERCOT grid should be technically feasible. But cost must always be one key criterion and part 1 did not address cost.
It is recommended that you read part 1 first.
The article below recaps the proposed 100% renewable solution from part 1, summarises the low and high range of total future 100% renewable electricity costs and includes a comparison with current Texas wholesale electricity prices. For casual readers this may be enough information. A link is provided to general pricing method information and the detailed current and future costing of individual components. Finally there are a few paragraphs on regulation and a summary.
Some caveats. This article is specifically about Texas. Texas has excellent wind and solar resources and the 2030-40 renewable generation costs are specific to Texas because they are based on current Texas costs. For instance solar PV costs elsewhere will differ from those in Texas. In New York, UK or Germany costs would be higher because there is less sunlight. In Chile or parts of the Middle East and Africa they would be lower because the sunlight there is even better. Some capital costs are global, such as those for battery storage, but since the cost of capital differs between countries, may still lead to different contributions to electricity costs.
To avoid any more confusion the term “grid model” spreadsheet used in part 1 will be replaced by the term “grid hourly simulation” spreadsheet in this article.
Finally, despite my best efforts, please do not treat the future 2030-40 costs as definitive – although hopefully they give a good indication of what is to come.
Summary from Part I
The grid hourly simulation download shows that in scenario 3 of part one 100% renewable generation could meet 2010-12 ERCOT demand scaled to a peak of 71 GW using the following system components and attributes.
While in 2030-40 the total load might vary from this, it is assumed that it will follow the same overall profile as in 2010-12. Since unit electricity costs are dependent on this profile, any increase or decrease in load should not change the unit costs significantly. In practise future additional ERCOT loads, such as electric vehicle charging, are likely to be more flexible than historic loads.
100% renewables system cost contributions
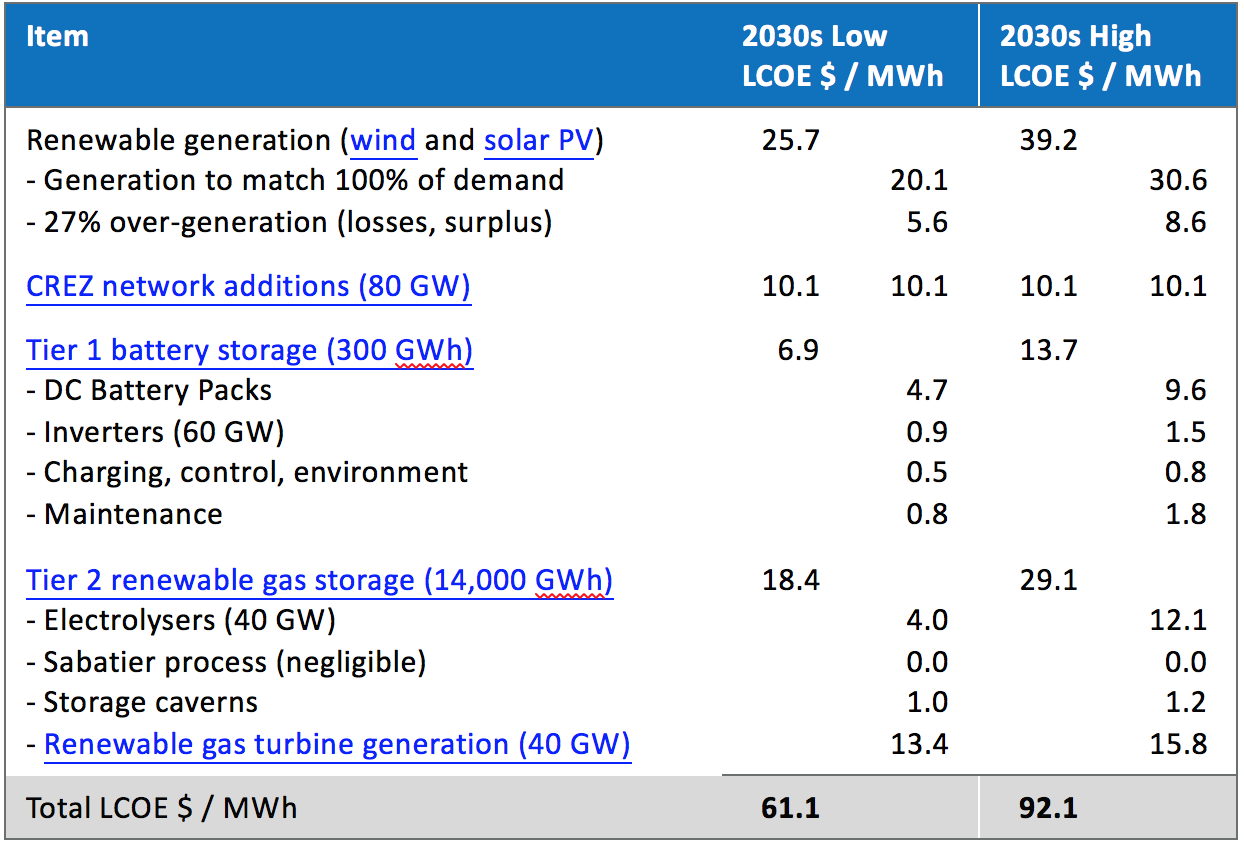
The table below gives the contribution of each component to the average cost of electricity supplied.
LCOE is “levelized cost of electricity” and is a method of assigning a single cost in $ / MWh to the cost contribution of each component of the solution. The aim of using LCOE for the cost model spreadsheet is to simplify it and thus make it easier to understand. There is also a table below of the approximate new capital sums required.
The 100% renewable solution wholesale cost of electricity would thus be between $61 and $92 / MWh, or 6.1 to 9.2 cents / kWh.
LCOE costs in the table above are derived either from current LCOE costs or from current capital costs. Where the cost has been derived from capital costs a 6% cost of capital has been used. Subsidies are excluded (i.e. all costs are before subtraction of any subsidies which might be available at that time). The overall sensitivity to the cost of capital is in a further table. Tax implications are not taken into account.
The detail component links explain the derivation of each LCOE from current or near-future costs and learning rates.
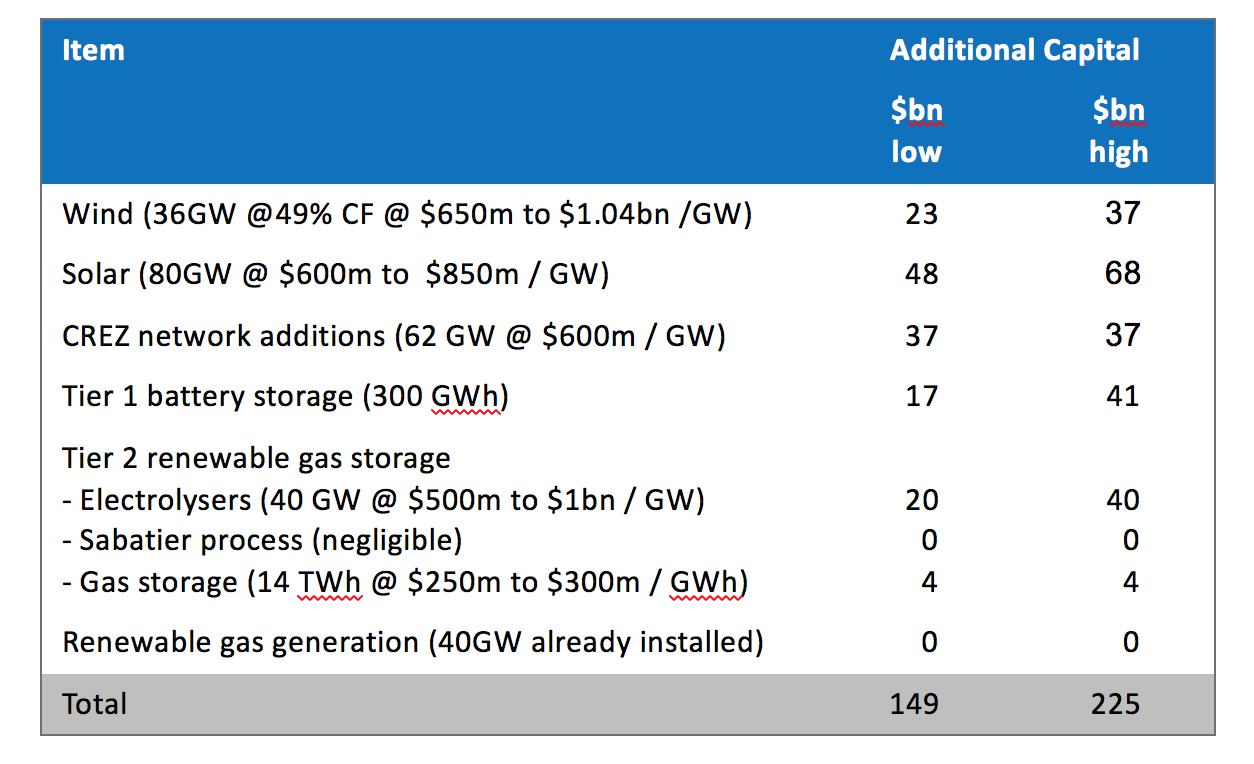
Additional Capital Expenditure
These figures are approximate. A lot of them will hopefully improve if the approach to estimating future LCOEs is as conservative as intended. For instance increasing the capacity of existing CREZ transmission line routes by a factor of seven could result in considerably lower unit costs due to increasing scale. New transmission line unit costs may also get cheaper over time with increasing automation.
If the tier 2 mixed renewable gas storage process referred to in part 1 becomes mature and economic it would mean a smaller electrolyser capacity requirement and cost.
These possible developments are likely within the 13-23 year timescale but reductions are difficult to quantify right now, so no attempt has been made.
This article is based on a peak load of 71 GW and average load of 39.5 GW. However, the load and thus capital requirements might also go down or up as future energy efficiency improvements offset new possible loads. Air conditioning is already a significant electrical load, but a switch to electric vehicles and electric heating of buildings with heat pumps could add multiples of 10% to the existing load. Although the capital costs would vary with higher loads, the LCOE figure should be similar as the whole system would expand pro rata.
The total capital cost figures are significant. One comparison is that the 19 GW of wind currently installed on the ERCOT grid by the end of 2017 probably averaged something like $2bn / GW, for a $38bn total over 15 years, topped up with additional gas generation installed which is relatively cheap and with $7bn for the existing CREZ network enhancements – perhaps a little higher than $50bn of total capital investment over 15 years.
Another investment comparison is from a report on possible USA oil and gas investments between 2017 and 2035 which suggests a total between $1.06tr and $1.34tr. Texas electricity load is 10% of that of the USA electricity grid so could perhaps be compared with $106bn to $134bn of oil investment from this report. Texas renewables electricity grid capital investment levels are somewhat higher than that.
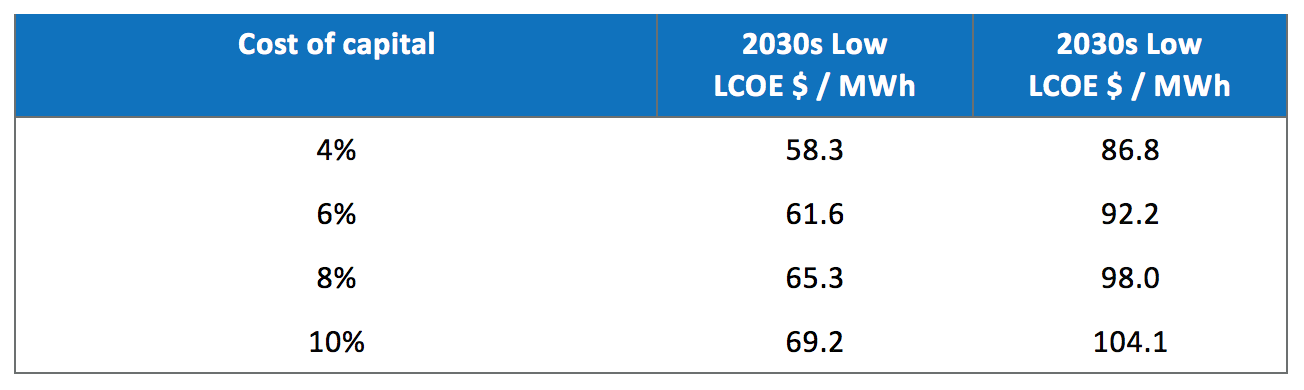
Sensitivity to cost of capital
The sensitivities below have been calculated by varying the single cost of capital (discount rate) figure in the cost spreadsheet.
The overall LCOE does not appear to be highly dependent on the assumed cost of capital.
Bear in mind that $40.0 of the low LCOE and $57.1 of the high LCOE costs have been derived directly from LCOEs (wind, solar PV, gas turbine generation) and are thus not affected by changes to the spreadsheet cost of capital percentage. Effectively the assumption is that the implicit cost of capital will not change at all for costs derived from current LCOEs.
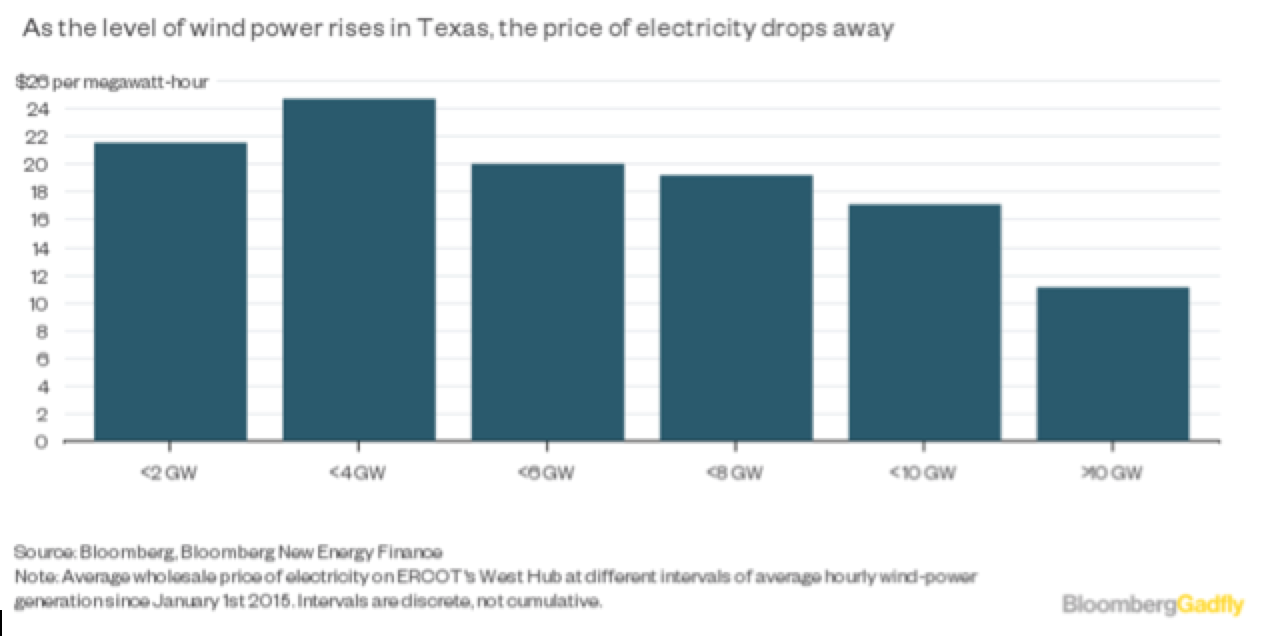
Comparison with current ERCOT electricity wholesale prices
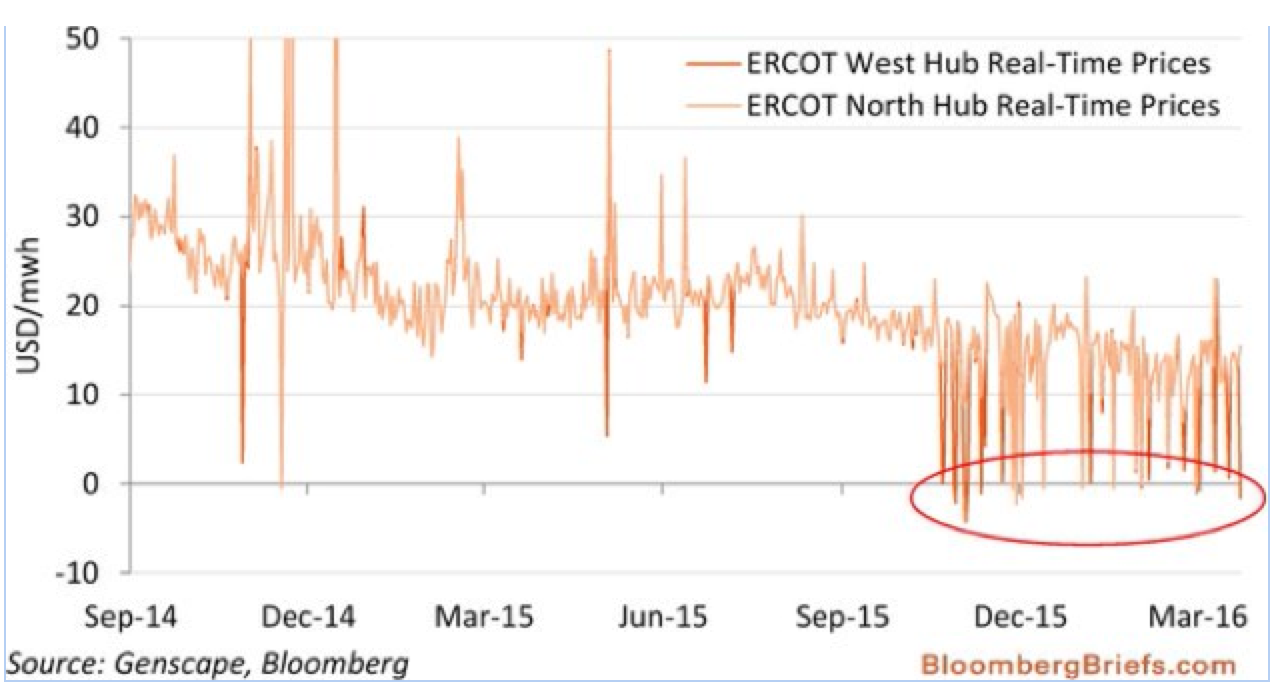
Average prices for recent years are given in the chart below. The recent price reductions are mainly due to the decreasing price of Texas natural gas.
These prices are not comparable to the range of costs for the 100% renewable Texas proposal. They may not include the ERCOT overheads such as the transmission network costs, of which the CREZ network enhancements would be a significant fraction.
Due to reductions in the Texas natural gas prices, recent annual electricity prices are lower than the range of costs for the 100% renewable solution proposed. But 2016 ERCOT prices are probably unsustainably low.
The presence of large quantities of PTC-subsidised wind power appears to lower average power prices, sometimes becoming negative as the charts below indicate. Negative power prices will become almost impossible once all wind farms reach the end of their ten year subsidy periods soon after 2030.
At 2016 average ERCOT prices of $25 / MWh, coal and nuclear plants are unprofitable and would eventually close. The resulting downturn in coal and nuclear generating capacity would increase average electricity prices. New natural gas generation would not be profitable either, though old plants fully depreciated might remain profitable. New wind with a PTC subsidy can compete and new solar may be able to if the costs go down rapidly enough.
At the 2016 average Henry Hub (Texas) natural gas prices of around $2.5 / M Cu Ft (thousand cubic feet) the cost model shows an LCOE for CCGT (combined cycle gas turbine) generation with high capacity factors of $31.6 / MWh (low) and $33.1 / MWh (high) compared with an actual average price of around $25 / MWh. One possibility is that the installed CCGT generation was not profitable in 2016, in which case prices must rise at some point. Alternatively the installed CCGT generation is profitable but more fully depreciated than allowed for in the cost model. In that event, since the existing CCGT plant would be retained in scenario 3 (although fuelled by synthetic renewable methane), the cost model back-up generation costs should be reduced by something like $6.6 / MWH (low) or $8.1 / MWh (high) to correct for the real costs.
Although Texas has plenty of natural gas, the provision of more pipeline capacity to other US regions or an expansion of LNG (liquid natural gas) export terminal capacity would result in higher Texas natural gas prices more representative of the global LNG market. This would increase the electricity prices. If a future congress and administration ever passed legislation taxing carbon dioxide emissions this would also increase electricity prices.
The EIA projects Texas natural gas prices rising to $3.75 / M Cu Ft in 2019. At that fuel price the cost model gives a CCGT LCOE of $38.9 – 40.4 / MWh for high capacity factors. Companies can hedge against future higher natural gas prices by signing a power purchase agreement directly with wind or solar PV electricity providers. The price is fixed apart from cost of living increases. Companies are generally prepared to pay a premium on current prices to achieve such certainty.
Regulatory considerations
Texas legislature enacted SB 943 which categorises storage as a “generation asset” and thus requires ERCOT to allow grid connection on request. The Texas PUC (Public Utility Commission) enacted rules 25.192 and 25.501 which ensures storage is treated as (deregulated) wholesale generation and does not incur fees for transmission (since it charges at the same point in the network as it discharges) or retail distribution. As well as other applications of storage, these rules encourage use of storage to time shift electricity supply where the provider of the storage is assumed to take advantage of arbitrage (charging when electricity prices are low and selling when they are high).
Rules such as these enable storage to compete with some of the current, more expensive “peaker” plants which are inefficient, have high fuel costs and generate only when electricity rates are high. They may also be sufficient to get to a high level of renewables and storage, but not to a 100% renewables solution. One problem is that high levels of storage in themselves reduce the price discrepancy between peak times and off-peak times – a phenomenon known as self-cannibalisation.
There are other regulatory issues in an economic 100% renewables grid. The requirement for (renewable) gas turbine generation is clearly sporadic, and the plant owners may be reluctant to take high per unit payments for only those occasions when back up renewable gas generation is actually required as the load factor of 6% is low will vary year by year. A similar problem occurs with the requirement to produce hydrogen or methane via electrolysis – the availability of spare electricity is intermittent, requiring provision of capacity with a small load factor of 18%. Again payments would vary year by year.
One solution commonly adopted elsewhere is for the majority of revenue for such plant to come from capacity payments with only a small proportion of revenue from generation or actual use. So far the ERCOT tendency to avoid making capacity payments has resulted in lower electricity prices, but this policy may not work well in securing the necessary investment at much higher levels of renewable and storage penetration.
One further issue is that Texas utilities cannot own generation or storage. There are ways around this, but it certainly needs thinking about. Currently the Texas wind power boom has been financed almost exclusively by private capital.
The current regulations controlling the ERCOT grid will not be sufficient to allow a 100% renewables solution to be implemented in a cost-effective manner, even if the raw costs are economic as presented above. The required, supporting, regulatory changes will certainly exercise the minds of the experts in the Texas PUC and ERCOT for some years to come. Fortunately the situation will develop only slowly, giving time to develop and test policies before the effect of them becomes crucial a decade or more from now.
Conclusions
In terms of demand and supply, a reliable, 100% renewable grid solution for Texas is possible using large-scale technology available today. No major technical innovation is required, and no miracles! Based on current Texas and global prices and trends the average cost of wholesale electricity before local distribution costs is likely to be between $61 and $92 / MWh. Although affordable, these costs are higher than Texas wholesale 2016 prices averaging $25 / MWh, which look unsustainably low.
Some caveats. This article is specifically about Texas. Texas has excellent wind and solar resources and the 2030-40 renewable generation costs are specific to Texas because they are based on current Texas costs. For instance solar PV costs elsewhere will differ from those in Texas. In New York, UK or Germany costs would be higher because there is less sunlight. In Chile or parts of the Middle East and Africa they would be lower because the sunlight there is even better. Some capital costs are global, such as those for battery storage, but since the cost of capital differs between countries, may still lead to different contributions to electricity costs.
Potentially cheaper, currently less mature, technology may be robust and economic by 2030-40 which could reduce the costs of such a 100% renewable solution.
Don’t treat the numbers in these articles as definitive. See them instead as a guide as to what to expect in the 2030-40 time frame. Let us all see what actually happens. Interesting times.
Moderation notes: As with all guest posts, please keep your comments civil and relevant.
—————-
APPENDIX – Technical details
Before delving into the detailed component costs, some general information may be helpful.
Cost model spreadsheet
The spreadsheet cost model calculates the average future cost of electricity supplied in 2030-40, irrespective of whether it was supplied direct through renewable generation, through the tier 1 battery storage, or through the tier 2 renewable gas storage using gas turbine back-up. It uses grid hourly simulation inputs and outputs together with ranges of costs and lifetimes for various system resources and the cost of capital, assumed to be 6%.
The cost model is available here to download and modify at will, either to cost different scenarios or to adjust the ranges of future costs to reflect different information or to determine how sensitive the result is to the individual cost ranges. The same link also includes the grid hourly simulation and its user manual.
In the cost model spreadsheet the CFs (capacity factors) for wind and solar PV generation are used solely in an average of LCOEs weighted by type of generation (wind vs solar PV). Since, from the grid hourly simulation, the default CFs are very similar (32.5% and 32.4%) the exact proportion of wind and solar has little effect on overall generation costs. The CFs are not used in the calculation of the future LCOE of the wind or solar PV generation.
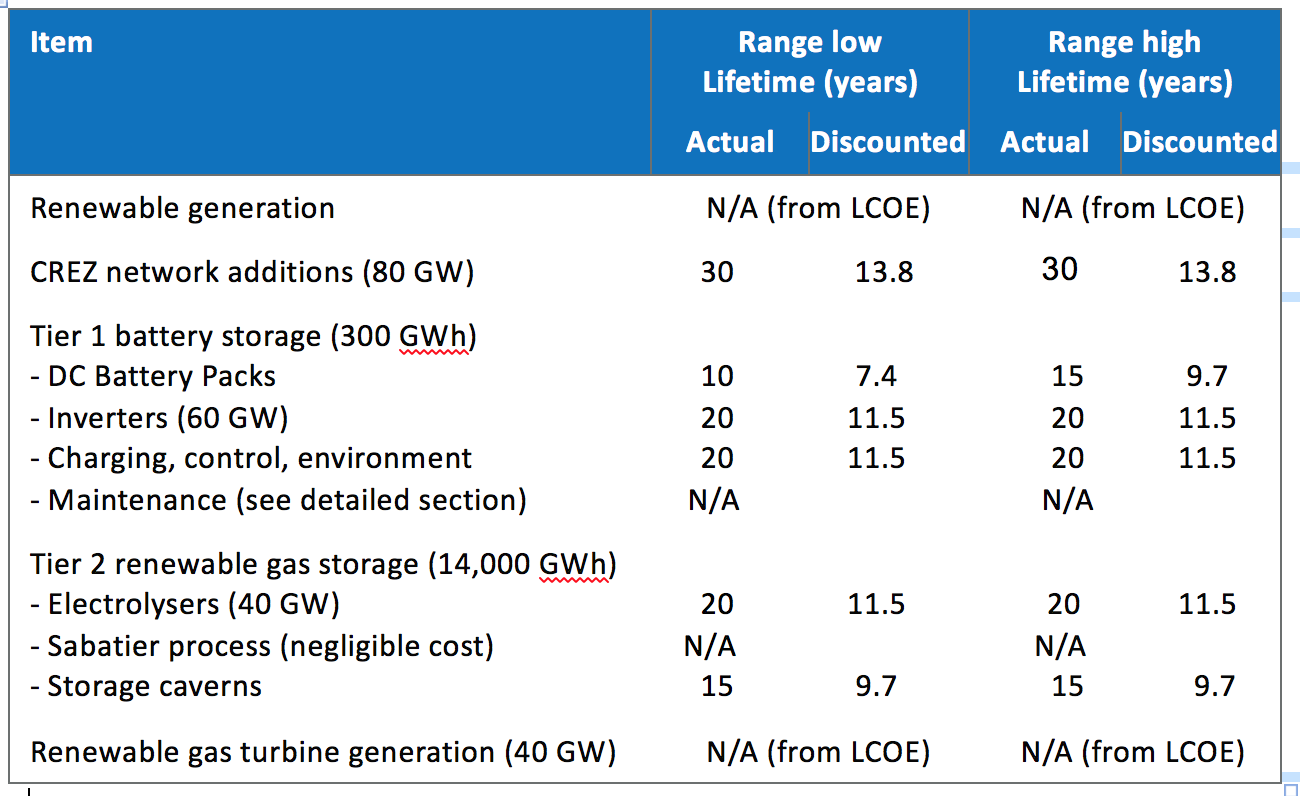
Actual and discounted lifetimes
The assumed actual lifetimes are given in the table below. The discounted lifetimes are calculated from the actual lifetimes but also take into account an assumed 6% average cost of capital. The discounted lifetimes must always be lower than the actual lifetimes. Dividing capital cost by discounted lifetime gives the annual capital charge for a component which can then be spread over annual electricity supply to give the LCOE capital cost contribution for that component.
For a 6% cost of capital the maximum discounted lifetime would be 16.7 years, representing interest payments for a component with an infinite lifetime.
Learning curves
The costs of wind and particularly of solar PV generation and battery storage have reduced dramatically over the last few years. This has been due to product improvements and to the manufacturing learning process which, since the days of the model T Ford, has resulted in a similar percentage price drop for manufactured products for each doubling of the global installed capacity. The drop depends on the product and technology.
The range high cost estimates of system components have been made taking into account current Texas costs where available (e.g. wind, solar PV), or global costs if not (e.g. battery storage), with a very conservative learning-rate discount applied. The range low cost estimates typically assume the full historical learning rate reductions apply to each future doubling.
US federal tax credits
The US Federal PTC subsidies applied to the 2015 or 2016 Texas prices for wind and solar PV which are used to represent current costs. Anonymous PPA (power purchase agreement) strike price information is available. It excludes the PTC refund, which is a direct reduction of the tax liability on profits generated by the equity partners in the renewable generation project. This subsidy is thus paid directly to the project by the IRS and is not part of the PPA contract price paid by the purchaser of the electricity.
There is no doubt that the IRS contributed around $23-24 / MWh for the full PTC tax subsidy in 2015 and 2016, but this is not the same as the value to the project. The problem is not difficult to see. Texas wind PPA contracts signed in 2015 are for less than $20 / MWh (2 cents / kWh). On its own, this revenue is far too low to allow a claim for $23-24 / MWh tax reduction. Solar PV PPA prices now start at $31 / MWh, also low enough to cause the same problem. Clearly there was much less of a problem when wind and solar PPA contracts were well above $100 / MWh.
One project option is to bring in an equity partner whose profits mainly come from areas other than low-cost renewable energy projects. Such partners need an additional cut of profits to make participation worthwhile. Thus the PTC tax subsidy is worth less to the other project partners than the IRS is paying out. A report and presentation on tax incentives by the Lawrence Berkeley National Laboratory contains estimates that the true value to projects of the full PTC of $23-24 was around $15 / MWh (two thirds of the subsidy) which is the 2015 and 2016 PTC value assumed in this article for wind and solar PV projects. The URL above has recently changed twice, but in case of further problems copies of the report and presentation files are also available in the Dropbox folder linked here.
One way of looking at it is that if the PTC had not been available then less costly long-term bank loans rather than more costly equity would be used for more of the capital funding.
Thus the PTC is no longer an efficient tax subsidy. It served its purpose in bringing USA wind and solar power to mass market volume. But it has already been discontinued for solar PV, though the ITC remains, and it is reducing 20% each year for wind power construction starting before 2017 before complete phasing out for construction starting in 2020. The basis for it is thus unlikely to be changed now.
The ITC (investment tax credit) is an alternative for both wind and solar but is less generous at today’s renewables’ prices. Recently it was 30% for projects starting construction before 2017 but then scales down each year until 2022 at which point it will remain at 10% for solar power until the law changes.
None of the range high or low costs for 2030-40 assume a subsidy. In the cost derivations in the links below the PTC rate has been used only in the calculation of current unsubsidised costs.
Detailed 2030-2040 cost derivations
The following links go into some detail on how 2030-40 Texas costs for the individual components are derived from the available reference sources. Be selective if you wish!