by Peter Davies
Scenarios to understand how load, wind, solar PV and storage interact and whether a 100% renewable grid for Texas is technically feasible.
Given the stated policy of the new USA administration this might not seem the best time to explore whether renewable electricity generation can provide most of the USA’s electricity economically around 2030-40. However, there is every sign that installation of wind and solar power in the USA is continuing. Texas has, not only plenty of wind and sunshine, but also by far the largest capacity of wind power installed of any US state. So Texas is a good place to start. If a 100% renewable grid won’t work for Texas then it won’t work anywhere else.
This article is the first of a pair and will cover non-financial aspects of the present and future Texas electricity grid. The aim is to present scenarios to understand how load, wind, solar PV and storage interact and whether a 100% renewable grid for Texas is technically feasible. The spreadsheet grid model used to analyse the scenarios is made available to enables checking of the findings of this article or investigation of alternative scenarios.
A second article will be based on a spreadsheet cost model providing ranges of costs. Future Texas price ranges are estimated from current prices, learning rates and other information.
Texas used more electricity than any other US state in 2015 – nearly 400 TWh (10% of the USA total) – followed by Florida and then California whose grids are half the size. ERCOT (the Electricity Reliability Council of Texas) manages more than 90% of the electricity in Texas. In this article the term “Texas” is often used loosely to mean the parts of Texas covered by the ERCOT grid. The ERCOT grid is largely isolated from the Western and Eastern USA grids and thus straightforward to analyse.
The simple spreadsheet model of the ERCOT grid will be introduced first. Then there is an outline of the current Texas grid, an analysis of the characteristics of Texas wind and solar PV (photovoltaic) generation and load and an exploration of scenarios with increasing renewable generation and storage. The same demand profile is used across all scenarios.
To keep things simple various low-carbon technologies are not considered here. The scenarios include no nuclear, solar thermal (using the heat of the sun to heat water to steam then used for generation), demand response (reducing demand when there is a deficit of renewable energy), hydro (Texas has only around 500 MW), biomass, offshore wind or rooftop solar. That does not mean they do not have a role to play, but to include them makes the analysis results more complex and more difficult to understand.
ERCOT grid model
The grid model and its manual are available to download from here. The grid model allows you to check the conclusions of this article or explore alternative scenarios.
Grid model scenarios are created by configuring peak demand, capacity of solar PV at 3 different locations and of total wind capacity. Other input options include grid battery storage size and losses and back-up gas turbine capacity. To investigate a 100% renewable solution renewable gas production, storage size and losses are included. There is a supporting document explaining in some detail how to use the grid model.
The demand and renewables vary by hour based on the following public data for 2010 to 2012 :
- Actual ERCOT electricity demand by hour
- Actual ERCOT wind power generation by hour
- Derived solar power generation by hour calculated from direct normal irradiance solar data from SolarAnywhere. The data and metadata come from NREL (National Renewable Energy Laboratory).
The spreadsheet contains hourly load, expected solar generation and actual wind generation. It calculates the gaps in supply, the surplus generation, the effects of different tiers of storage and of back-up generation.
As the grid model uses only 3 years of hourly data the results should be treated as indicative rather than definitive. However, it should provide a first-cut estimate of the grid behaviour and is a good vehicle for exploring the interactions between load, renewable generation, storage and back-up.
Any specific issues or questions relating to the mechanics of the grid model should go here rather than on Judith’s site.
Texas Climate and Renewable Resources
Texas climate varies from arid desert in the West to humid and subtropical in the East, as in the global solar radiation map below.
The further west you go the better the solar power will be.
The Texas Panhandle region wind is part of the Great Plains wind system. Warm moist air from the Gulf of Mexico collides with frigid air from the arctic and strong winds blowing east off the Rocky Mountains giving wind speeds 2 m/s higher than the USA average.
The Current ERCOT Grid
The Texas 2016 grid consists of 46,000 miles of high voltage transmission, peak demand of 71 GW (which occurs in summer), average demand of 39.5 GW, and 570+ generating units capable of supplying 78 GW or more at the summer peak. It covers 90% of Texas load and supports 24 out of 27 million Texans. 2010 ERCOT summary data is here for comparison.
Capacity, Generation, Load Factor
The capacity at the end of 2016 and the generation in 2010 and 2016 are in the charts below.
Gas and wind equally have pushed coal firmly into second place while also providing a 33 TWh (10%) increase in generation between 2010 and 2016. Nuclear has made a stable contribution for some time.
The load factor for coal has fallen from 76% in 2010 to 59% in 2016. In the competitive Texas power market coal is losing out to cheap natural gas and wind power with PTC (production tax credit) federal subsidy. Both IEEFA and Brattle Group believe coal is economic and on the way out.
New generation
The ERCOT grid market is open to all generators. The generator pays for the spur to the nearest POI (point of interconnection) on the high-voltage transmission network, and for any upgrade to the POI substation equipment. ERCOT pays for any co-requisite upgrades to the high-voltage transmission network. The process goes through the four stages on the chart below with increasing chance of the new plant being built. Following connection contract signature, the new generation project has to pay a deposit before ERCOT will contract with suppliers for transmission line upgrades. The deposit is refunded once generation starts.
The December 2016 ERCOT interconnection queues contained the following proposed new generation.
The wind and solar PV on the queues dwarf the renewables already installed. Historically, 70-80% of wind projects in the queue drops out before installation. There’s less of a track record to judge solar drop outs. But with the PTC subsidy annual reductions and eventual expiry, the fraction of wind and solar projects dropping out now may be much lower than normal. Scenario 1 below shows that if everything in the current queues is installed the ERCOT grid would be more than 50% renewable generation.
CREZ Transmission Network
To support huge levels of wind and other power generation remote from the population centres ERCOT invested $6.7bn in a CREZ (Competitive Renewable Energy Zones) network upgrade. This supports transmission of up to 18GW of wind and solar power from the windy and sunny regions in West Texas and the Panhandle to the population centres in East Texas.
Texas variable renewables wind and solar PV?
Solar PV (photovoltaic)
ERCOT has only 500MW of utility solar PV installed at present, and most of this is in the less sunny regions close to the population centres rather than in Panhandle and West Texas areas with excellent sunlight. But there is a massive 13GW of solar PV in the interconnection queues! Recent Texas solar PV PPAs (purchase price agreements) are below 3.5 cents / kWh and exclude the PTC federal tax subsidy of 2.3 cents / kWh which is paid separately direct to the generator. In other words the total cost is currently higher than 3.5 cents / kWh.
The grid model utility solar PV output assumes two-axis tracking of the sun i.e. during the day the solar panels always point at the sun. Thus generation is proportional to DNI (direct normal irradiance). Most new USA utility solar PV systems now use at least one-axis tracking. Two-axis tracking takes a little more space and costs a little more, for which the benefit is a higher CF (capacity factor) giving more revenue to the project.
The grid model assumes an ILR (inverter loading ratio) of 1.26, slightly lower than 1.31 for the typical recent USA utility solar PV system. This is the ratio of the maximum DC power output of the solar panels to the maximum AC power output of the inverters and grid connection.
The solar PV default grid model generation is based on 20% solar generation close to the eastern, less sunny population centres (averaging 27% CF) and 80% from the West Texas and Amarillo CREZ areas (34% CF). This results in an overall AC CF of 32.4% for solar PV for the grid model. The grid model is a little optimistic in the conversion of solar irradiance to AC power due to the method of averaging.
Let’s examine solar PV generation at noon.
50% of days Texas solar PV would generate at least 86% of the maximum possible AC grid power at midday. 75% of days it would generate at least 64% of the maximum. Clearly there is no generation at night and generation will be lower early and late in the day. Texas daytime solar PV power is reasonably, but not perfectly, reliable.
Wind power
West Texas is home to oil and gas drilling, and the rural population is typically conservative. But ranchers have embraced wind power to make a living out of land which might otherwise be only marginally profitable. Red-state Texas is the “Wild West of Wind” and installs wind power solely for economic reasons. Today it has nearly 21 GW installed, three times the installed wind capacity of Iowa which beats California in the race for second place.
The grid model uses actual hourly wind generation over all Texas between 2010 and 2012. Although individual wind farms do hit maximum rated power some of the time, the overall Texas wind power hourly capacity factor almost never exceeds 80% of the theoretical maximum. The annual average wind CF factor for the Texas wind data is 32.5%, coincidentally very close to the solar PV CF of 32.4% above.
Most wind farms installed by 2010-12 were not in the CREZ zones which get the best wind.. More recent wind farms have mainly been installed in the CREZ zones. I have seen the results of a CF calculation based on actual hourly figures for 2010-2012 showing a wind CF of 49% in CREZ regions, but this more detailed data is not publicly available.
The trend since 2012 has been for US onshore wind turbines to have larger rotors, with a larger swept area (proportional to the square of the rotor diameter), without a corresponding increase in the generator size. Originally it was thought such turbines, designed for lower wind speed, could not cope with the turbulence of higher wind-speeds in places like Texas, but this has been shown not to be an issue. Clearly this has also contributed to higher CFs. From private correspondence with BNEF (Bloomberg New Energy Finance), the BNEF benchmark Texas onshore wind CF is also 49%.
At noon wind has more days with lower CF than with higher CFs. At midnight the higher CFs predominate. Thus wind power is more reliable at midnight than it is at noon. At 6 am and 6 pm the wind CF charts (not shown) are flatter as is the “all hours” wind output chart above.
Texas Load, wind and solar correlation coefficients
(Pearson) Correlation Coefficients
Texas Load
All Texas Wind
Texas Solar
Texas Load
1.0
-0.23
0.39
All Texas Wind
-0.23
1.0
-0.22
Texas Solar
0.39
-0.22
1.0
Correlation coefficients vary from 1.0 (e.g. high solar generation always occurs at time of high wind generation etc.) through 0.0 (wind and solar are completely independent of each other) through to -1.0 (high solar generation always occurs at times of low wind generation and vice versa).
During the day demand is highest, particularly on hot days when air conditioning is heavily used. Fortunately, as we saw above, solar is reasonably reliable at these times and in particular the grid model shows it is very reliable on hot days (no surprise here!) and this is reflected in the 0.39 correlation. With a negative -0.23 correlation wind will not help as much with peak daytime loads. It can’t be seen from the correlations, but night-time wind, though less reliable than daytime solar, does a reasonable job of meeting night-time demand.
The negative -0.22 correlation between wind and solar means that, while they can interfere with each other occasionally, high wind output tends to coincide with low solar output and vice versa. The inference is that a combination of wind and solar should provide a more consistent supply with fewer gaps than either wind or solar individually and the grid model will be used to check this. Similarly the CREZ network can be shared between wind and solar PV without large levels of interference between them. A CREZ network with the capacity of the larger of wind and solar capacities would thus avoid significant curtailment of either. For simplicity the transmission network is not explicitly included in the grid model.
Demand and Renewable Supply
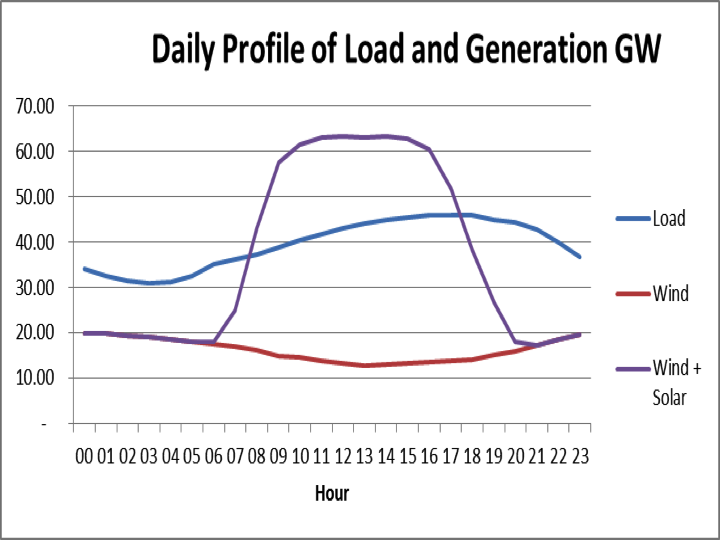
This chart is based on the grid model spreadsheet set for 64GW of solar capacity, 60GW of wind, and load peaking at 71GW giving an average load of 39.5GW and matching average generation of 40GW.
Compare the blue (load) line with the purple (wind plus solar) line. On average, during the day there is excess solar generation until 6pm (the axis tick mark is before the number 18), followed by a big deficit until midnight and then a slightly smaller deficit until solar kicks in again. Additional wind and solar generation (creating a surplus) and large quantities of storage clearly have a role to play in minimising these gaps.
Remember that within the averages plotted on the chart there are large fluctuations as described above.
That’s probably as good an intuitive understanding of Texas load and renewable generation as charts alone can give us, so let’s now use the grid model to analyse some possible scenarios.
Scenario 1 – entire current interconnection queue gets installed
First we need to do some adjustments because of differing capacity factors.
The 26.7 GW of wind in the queues is likely to be installed mostly in CREZ regions with an expected CF (capacity factor) of 49%. This would be equivalent to 40 GW of extra wind capacity at the 32.5% CF of the grid model. Add back 17 GW already installed at the end of 2016 for a total of 57 GW of wind at the grid model CF. This wouldn’t behave in precisely the same way as the real mixture of capacities and CFs, but will give a reasonable first approximation.
There is 13.7 GW of solar PV in the interconnection queues and 500MW installed, all with expected single-axis tracking with a lower CF of 26%. This is broadly equivalent to only 11.3 GW at the grid model CF of 32.4%.
Texas already has 48.4 GW of natural gas generation and there is another 18.6 GW on the queues, giving a total for this scenario of 67 GW.
Here are the grid model results :
Capacity
Demand Coverage % (Surplus %)
Wind GW
Solar GW
No Storage
Peak Deficit
57
11
54% (2%)
62 GW
0
11
9% (0%)
67 GW
Installing everything in the queues would move ERCOT to over 50% renewables generation with around 4% of the renewables generation (2% of average demand) as surplus.
On a simple view the unsatisfied peak load after subtracting wind and solar generation would be 62 GW. A high correlation between the air conditioning peak and a high level of solar generation is probably a safe assumption because they are likely both caused by hot sunny summer days. But with only three years of data it is not safe to bank on a minimum level of wind generation always coinciding with the summer air conditioning peak. Removing all the wind capacity changes the unsatisfied peak deficit to 67 GW. If all the gas generation in the queues gets installed too, there is exactly 67 GW of natural gas generation to cover the peak load gaps, although ERCOT would never operate on such tight margins.
It isn’t necessarily going to happen like this – some of the wind and solar capacity under investigation is bound to drop out of the queues before getting installed. But 50% renewable electricity is not necessarily that far off for ERCOT.
Interestingly, if all 57 GW of wind power (at 32.5% capacity factor) in the queues was installed it would break the back of the required wind capacity in the other scenarios below, at PTC-subsidy costs.
Scenario 2 – Maximum renewables with no more than 10% surplus
Each line represents multiple grid model settings to find the maximum percentage of generation (GWh) that has a surplus of no more than 10% of the renewable power generated.
Because the overall capacity factors for wind (32.5%) and solar PV (32.4%) just happen to be so similar (I didn’t fix it to come out like that!) then the same GW capacity for wind and solar will produce the same average GW actual generation. However, this generation will be at different times of day and with different seasonal variability.
Capacity
Demand Coverage % (Surplus %)
Wind GW
Solar GW
No Storage
50 GWh Storage
0
52
39% (4%)
41% (2%)
36
45
60% (7%)
63% (3%)
45
41
64% (7%)
67% (4%)
54
37
67% (8%)
69% (5%)
60
31
68% (7%)
70% (5%)
66
25
67% (8%)
69% (5%)
75
0
56% (6%)
57% (4%)
Solar PV on its own can provide 39% of the total demand. Wind on its own does even better, satisfying 56% of demand.
A combination of both wind and solar does best. Without storage this potentially could provide up to 68% of total demand without wasting more than 10% of the renewables generation. Around a 2 to 1 ratio of wind to solar appears best, though the optimum is quite broad. This is the scenario Texas is naturally heading towards – plenty of existing and planned wind generation but with increasing amounts of solar in the ERCOT interconnection queues.
Storage and Grid Control
Grids require mechanisms to control frequency and voltage in the short and medium term, and also must ensure there is no shortage of supply to match demand at all longer time scales. In historical grids dominated by generators driven by coal or gas, the generators are rotating synchronously (at some simple fraction of the AC frequency) and have significant mechanical inertia (kinetic energy of rotation) which automatically damps fluctuations of up to a few seconds in frequency or voltage, whether caused by large short-term changes in demand or in supply. After a few seconds more (or less) input power to individual generators is supplied automatically through governors controlling medium-term stability of the electrical output.
Grids powered mainly by wind or solar do not have this automatic damping of short-term fluctuations. Although wind turbine rotors have mechanical inertia it is not synchronised with the AC frequency as the matching is done by electronic methods. Wind and solar PV farms can provide simulated inertia electronically but this requires them to be operating at less than optimum output levels most of the time.
Hourly load and generation numbers as used in the grid model hide any rapid changes in total renewable output within the hour and it is not possible to determine whether the back-up natural gas turbine generation can ramp up to required output immediately without undue thermal and mechanical stress. 50 GWh of grid battery storage would smooth renewable generation and demand and guarantee back-up generation can match demand to supply while minimising backup plant stress. Such battery storage would also enable short-term grid control and stability functions to be assumed by the battery storage systems, enabling wind and solar PV farms to operate at maximum possible output levels most of the time.
Solar contribution to reducing back-up capacity
The grid model also helps with the calculation of required back-up capacity. We have set the peak load to 71GW (for which the average load works out at 39.5 GW). The residual peak back-up requirement with 52 GW of solar generation comes down to 63 GW. You can use filtering on row 16 of the grid model spreadsheet to show that the 71 GW peak occurs during daytime solar generation, but that there is up to 63 GW of peak day demand between 8 and 10 pm with only a small dusk contribution from solar. So however much solar generation (without storage) there is it only shaves 8GW off residual summer peak demand
Let’s ask a different question. During the main solar generation period (say 9:00 to 16:00), what is the peak residual back-up requirement? This time the answer is 53 GW. Hot sunny summer days not only add 18 GW of air conditioning to the peak load but also guarantee a sufficiently high minimum solar generation capacity factor to satisfy the additional demand too.
Tier 1 grid battery storage
Texans like their trucks. The two most popular private use vehicles in Texas are trucks. For the whole of the USA cars occupy the four top slots before the Ford F150 truck gets a look in at number 5. Around 2030-40 most of the 9 million private vehicles in Texas could be electric vehicles with a range of 300 miles. Trucks requiring air conditioning would probably do considerably worse than 3 miles / kWh. 9 million x 100 kWh batteries represent 900 GWh of storage, dwarfing the 300GWh of ERCOT tier 1 grid storage required for scenario 3 below and certainly swamping the 50 GWh of storage suggested for this scenario. Such two-way power transfer is known as V2G (vehicle to grid) storage.
At a recent UK meeting I attended, arranged by the UK government, Eduardo Mascarell, head of V2G and Stationary Storage of Nissan Europe, forecast that vehicle manufacturers would allow V2G use with no reduction in battery warranty lifetimes. Nissan believes the additional degradation from V2G is small compared to normal use. He suggested that in exchange for V2G storage, grids might provide free charging of private vehicles, effectively providing free private travel for all local and some long-distance use.
Tier 1 battery storage needs to be efficient (good ratio of input to output energy) because it is used for significant fraction of demand (over 10%). Lithium ion or other battery technology is suitable as it has an efficiency of 80% or more, but it would be uneconomic if used to store more than a few hours of average load.
Scenario 3 – 100% renewables?
Is a 100% renewable solution technically feasible?
In the second part of this article we will look at the economics of a 100% renewable ERCOT grid, but will leave it to others to debate whether or not such a zero operational carbon solution is actually required.
The first use of the grid model in this scenario is to analyse how to cover over 90% of demand using a mix of renewable generation and relatively efficient tier 1 grid battery storage. The second is to work out how to close the remaining gap using much cheaper tier 2 storage.
155 GW of renewables split between wind and solar
(base for 100% renewable grid)
Generation
Demand Coverage % (Surplus %)
Wind GW
Solar GW
No Storage
50 GWh Storage
100 GWh Storage
300 GWh Storage
94% Coverage Storage
0
155
52% (75%)
57% (70%)
62% (64%)
81% (41%)
700 GWh
65
90
80% (47%)
84% (42%)
88% (38%)
94% (31%)
300 GWh
75
80
82% (45%)
86% (40%)
89% (37%)
94% (31%)
300 GWh
85
70
84% (43%)
88% (39%)
90% (36%)
94% (32%)
300 GWh
95
60
85% (42%)
88% (38%)
91% (36%)
93% (33%)
105
50
85% (42%)
88% (38%)
90% (37%)
93% (34%)
155
0
77% (51%)
79% (48%)
81% (45%)
86% (40%)
8000 GWh
Providing 155 GW of capacity as all wind or all solar would be a complete waste. If you added 300 GWh of storage you could push the coverage up to 81% or 86%, while you can achieve 85% coverage with 95 GW of wind, 60 GW of solar PV and no storage at all!
And it is also hard to achieve 94% demand coverage using 155 GW capacity of just wind or just solar alone plus tier 1 storage. The more reliable solar would need 700 GWh of tier 1 grid battery storage. Wind would require 8,000 GWh (8 TWh) which would be hugely wasteful given that just 300 GWh of storage is enough with a sensible wind/solar mix. This demonstrates that Texas wind and solar PV generation in the right locations complement each other well.
Is there enough suitable land in Texas for scenario 3?
The wind power density of the best locations in Texas averages around 2.5 W/m2. The average wind power required is 25GW. Thus 10bn square metres are required, which is 10,000 square km, or a grid 100km by 100km. The Panhandle and West Texas has many times this amount of suitable land.
Solar power in Texas requires about 5 acres per MW. An acre is about 4,000 square metres, so 1 MW is 20,000 square metres. 80GW of solar PV thus would require 80,000 (MW) x 20,000 (m2 per MW) = 1.6bn m2 or 1,600 square km, which would be a square 40km x 40 km. Again Texas has many times this amount of suitable land.
There is plenty of space on a wind farm to mount solar panels in between wind turbines so the required areas can overlap.
Tier 2 renewable gas storage
Though much cheaper per GWh stored, the proposed tier 2 storage is not very efficient during the charge and discharge cycle. So the gap it has to fill needs to be as low as possible to minimise total losses. 75 GW of wind, 80 GW of solar and 300 GWh of tier 1 grid battery storage would cover 94% of demand, leaving a 6% gap. Renewable generation would average 50GW while the load averages 39.5 GW, providing ample surplus (25%) to cover the tier 2 storage losses.
The deficit totalling 6% consists of gaps of one or more days up to one or more weeks. Based on the 2010-12 data the grid model shows that 14,000 GWh (14 TWh, two weeks of average load) of tier 2 storage would be sufficient. Although this quantity of lithium ion battery storage would be far too expensive, there are better solutions. The front runner is renewable gas chemical storage, described below.
Some options for long-term renewable gas storage for the Texas grid are :-
- Renewable hydrogen (43% efficiency)
- Renewable methane (34% efficiency)
- Renewable mixed methane and carbon monoxide (70% efficiency)
The efficiency figures are for power to gas and back to power. The low efficiencies of hydrogen and methane mean they cannot be used economically to fill gaps which are more than a small fraction (< 10%) of overall generation and supply. In this scenario tier 2 storage must fill a 6% gap which is comfortable.
The renewable hydrogen storage process uses electrolysis of water to produce stored hydrogen and discarded oxygen. The hydrogen is stored in tanks above ground or in underground salt caverns and used in fuel cells to provide back-up generation, though fuel cells are currently expensive for occasional (6%) use. As yet there are no hydrogen-compatible gas turbines.
The favoured option is renewable methane which also uses electrolysis of water. Hydrogen is converted to methane in a reactor using the industrial Sabatier process requiring a source of CO2 which could be stored exhaust from gas turbines when they provide backup power. The methane can then be used in expensive fuel cells or in cheaper standard gas turbine generators. All parts of this process have already been used at industrial scales, though not yet in an integrated long-term grid storage system.
The mixed methane and carbon monoxide process electrolyses water and carbon dioxide at the same time in the same solid oxide electrolysis cell at low temperatures and high pressures. Generation uses solid oxide fuel cells. Potentially the full process is 70% efficient – on a par with pumped storage hydro, and thus might also replace tier 1 battery storage. However, the technology is very early in the development cycle – much less mature than the renewable methane option preferred at this point.
Installation of sufficient wind, solar PV and tier 1 grid battery storage to cover 94% of demand cover will take a number of years. The mixed renewable gas storage process may thus be mature and economic enough by the time tier 2 storage is actually required.
A summary of the ERCOT grid configuration for the preferred renewable methane solution and the higher-risk renewable mixed gas solution is given below.
Component
Renewable Methane
Renewable Mixed Gas
Tier 2 storage efficiency
34%
70%
Wind
75 GW
72 GW
Solar PV
80 GW
75 GW
Tier 1 storage
300 GWh
200 GWh
Tier 1 inverters
60 GW
60 GW
Demand coverage (wind /solar/tier 1 storage)
94%
91%
Electrolysers
40 GW
30 GW
Gas turbine generation
40 GW
Fuel cells
40 GW
Tier 2 Storage
14,000 GWh
18,000 GWh
Losses + surplus
13%+14%=27%
6%+13%=19%
Reducing gas turbine back-up generation capacity
From the grid model “deficit” columns, scenario 3 (100% renewables) would seem to need 55 GW of peak back up gas turbine generation to satisfy 6% of total demand. But we have 300 GWh of storage and an average demand of 39.5 GW. If we can forecast in advance when peak gas generation will be needed, we can start gas generation earlier than absolutely necessary, charge the tier 1 grid battery storage in advance, and reduce the necessary gas turbine back up capacity by supplementing it with electricity from the batteries during peak times.
The grid model forecasting implemented is “perfect” in that it understands both future generation and load completely! It shows 30 GW is the lowest back-up gas turbine capacity that would achieve no supply deficit with perfect foresight – down from 55GW without using the battery storage. However, ERCOT will have to run the grid with real-world, imperfect forecasting, so an additional 10 GW has been assumed for a total of 40GW and a saving of 15GW. This clearly reduces the cost of the solution.
Conclusion
There are no obvious major technical show-stoppers for a 100% renewable electricity grid for ERCOT using wind, solar PV, tier 1 battery storage, low-risk tier 2 renewable methane long-term chemical storage and gas turbine generation back up.
75 GW of wind and 80 GW of solar PV at 32.4% CF, plus 300GWh of tier 1 battery storage can satisfy 94% of demand. The remaining 6% requires 40GW of electrolysers, Sabatier process plant, 14,000 GWh of methane storage and 40 GW of gas turbine backup generation. The required renewables over-generation of 27% of average demand covers storage losses and surplus (wasted) generation.
Part 2 of this article will examine the costs of such a solution and discuss some regulatory issues – can it be economically feasible?
Biosketch: Peter is a mature, part-time PhD student in the condensed matter theory physics group of Imperial College London. He uses Schroedinger’s equation to model nano-scale capacitor technology to understand whether it can be developed for use in challenging environments such as jet engines and electricity grids. In his youth he studied physics, maths , electrical science and computer science at Trinity College Cambridge. He worked for IBM UK for over 30 years in IT systems design at customers including banks, government departments and energy companies. Peter’s interests include energy and particularly electricity grids.
Moderation note: As with all guest posts, please keep your comments civil and relevant.Filed under: Energy